All posts by webprofits

How Much Can AI Really Improve Battery Materials Development?

Advances in battery materials development are driving a new era of energy storage innovation, paving the way for safer, more efficient, and longer-lasting batteries. Lithium-ion batteries are now deeply embedded in our daily lives, powering everything from electric vehicles to mobile phones, laptops, wearables, and drones. 

As demand grows for higher-capacity and more reliable batteries, researchers are exploring new chemistries to overcome the limitations of current technologies. 

While different types of lithium-ion batteries offer various benefits, they also involve trade-offs between cost, performance, and safety. Next-generation batteries promise to address these challenges and will be essential to powering the future of clean energy and connected devices. 

In this article, we explore how artificial intelligence is accelerating battery materials development—and how much of a game-changer it could really be.

Why Next-Gen Batteries Are Crucial for a Sustainable Energy Future

Next gen batteries like solid-state, lithium-sulfur, or lithium-metal are an essential component for a more sustainable future. They will enable the ability to store more energy in a smaller space and reduce charging times—critical for the scalability and convenience of EVs and e-mobility solutions. 

Many next-gen batteries can eliminate flammable liquid electrolytes found in current lithium-ion batteries, reducing the risk of overheating or fire—especially important in cars, aircraft, and large-scale storage. 

Enhancing the cycle life (number of charge/discharge cycles) of batteries will mean they can be replaced less often, which will lower costs and waste over time. Using less cobalt, nickel, or other scarce/raw materials, will help develop more sustainable batteries that are easier to recycle or repurpose. 

Battery innovation is vital to electrifying transport, integrating renewables into the grid, and reducing greenhouse gas emissions across industries. Without better batteries, the transition to a low-carbon economy will stall.

The rise of AI in materials research

Australia is quickly becoming a global hub for battery innovation—driven not just by rich reserves of critical minerals like lithium and cobalt, but by the rapid adoption of artificial intelligence (AI) in battery research and development.

From mining to manufacturing to recycling, AI is helping Australian scientists and engineers build better batteries, faster. AI can help accelerate innovation in battery development while reducing costs and optimising performance. 

Earth AI, an exploration technology company operating in Australia, offers a new approach to secure new mineral production in an industry that has remained stagnant and unchanged for decades. Earth AI is transforming critical minerals exploration through the innovative use of their proprietary artificial intelligence (AI) targeting software, integrated with a vertically integrated exploration model. Earth AI is vertically integrated from data driven target generation, to on-ground validation, and through to drilling using its own dedicated diamond drill rigs. This comprehensive structure enables rapid decision-making, reduces discovery timelines, and minimises environmental impact. The result is a scalable, next-generation exploration model that has already led to the identification of several new high-value prospects in overlooked terrains across Australia. 

Earth AI’s purchase of Thermo Fisher’s Desktop Phenom XL G2 SEM as an in-house, low-maintenance scanning electron microscope is assisting in expediting the analysis and evaluation of potential mineral targets. The addition of this system to the company’s existing capabilities is allowing more rapid turn around times for sample analysis, letting them pivot and move faster through the mineral landscape.This ease of use of the Phenom XL G2 has meant that any mineralogies of a curious nature or importance can be identified within a quick time frame. This gives its users the benefit of having a more robust understanding of the geology as quickly as possible, which in turn can be implemented in exploration processes. 

Can AI truly make a difference?

Traditional battery research relies on essential experimentation, which can be slow and expensive. In comparison AI can analyse vast datasets and run multiple simulations, to predict the performance of new battery materials before they’re even created in the lab. This is helping Australian researchers discover next-gen cathodes, anodes, and electrolytes with higher energy density and longer life. 

For example, teams at CSIRO and leading Australian universities are using machine learning to screen thousands of material combinations—cutting down years of research into months. 

This accelerated approach is vital for staying competitive in the global battery race. Lithium-ion battery manufacturer Recharge Industries has ventured into a partnership with Deakin University’s Applied Artificial Intelligence Institute (A2I2) to leverage AI in making better batteries. By integrating AI into their production lines the company hopes to reduce waste, lower costs, and boost scalability, which will help position Australia as a serious player in the battery supply chain.

Once batteries are in use, AI can help manage them more efficiently. AI-powered Battery Management Systems (BMS) can monitor performance, detect early signs of degradation, and optimise charging cycles. This extends battery life and ensures safe operation, which is especially critical in many challenging Australian environments. For grid-scale applications, AI can even help balance energy loads across multiple battery installations—supporting Australia’s transition to a clean energy future.

AI for Battery Sustainability & Recycling

AI can play a significant role in solving recycling and circularity challenges, particularly in the battery industry. AI-driven image recognition and robotics are already being used to identify, sort, and disassemble batteries more efficiently, helping to recover valuable materials like lithium, cobalt, and nickel. Machine learning algorithms can also optimise recycling processes by analysing chemical compositions and predicting the most effective methods for extracting and purifying materials from spent batteries.

Overview of Battery Materials and Their Role in Energy Storage

Materials are the heart of battery performance. The cathode and anode determine how much energy a battery can store and how long it lasts. For example, lithium nickel manganese cobalt oxide (NMC) offers high energy density, while newer materials like silicon anodes promise even greater capacity.

Importance for EVs, grid storage, and renewable energy

In EVs, materials that enable higher energy density, faster charging, and improved thermal stability directly contribute to longer driving ranges, enhanced safety, and better overall performance—key factors for broader adoption. For grid storage, durable and low-maintenance materials support batteries that can withstand daily charge-discharge cycles, helping to stabilise energy supply and reduce reliance on fossil fuels. 

For renewable energy, these materials allow intermittent sources like solar and wind to be stored and used reliably, making clean energy more viable at scale. Ultimately, innovations in battery chemistry are foundational to building a more sustainable, electrified future.

The Rise of Next-Generation Battery Chemistries

Emerging battery types and materials (solid-state, lithium-sulfur, etc.)

Solid-state batteries, which replace liquid electrolytes with solid ones, promise higher energy density and enhanced safety with reduced risk of fire. Lithium-sulfur batteries are gaining interest due to their potential for much higher energy capacity and lower material costs compared to traditional lithium-ion batteries. Sodium-ion batteries offer a more abundant and cost-effective alternative to lithium, making them attractive for large-scale storage applications. Meanwhile, flow batteries, which store energy in liquid electrolytes held in external tanks, are emerging as a strong contender for long-duration grid storage thanks to their scalability and long cycle life.

The need for innovation and material breakthroughs

Current materials often limit energy density, degrade over time, or rely on scarce and expensive elements like cobalt and lithium. Advancements in materials science—such as developing more stable solid electrolytes, high-capacity anodes like silicon, or sustainable cathode alternatives—are essential for overcoming these limitations. These breakthroughs will be key to enabling batteries that can meet the demands of electric vehicles, renewable energy storage, and future smart grid systems.

Can AI Overcome Current Battery Material Challenges?

AI works exceptionally well in areas of battery material development where large datasets are available and patterns can be uncovered faster than traditional methods. For example, AI excels at predicting material properties, screening potential candidates, optimising formulations, and simulating chemical interactions—all of which can significantly speed up the discovery process. 

Machine learning models can analyse thousands of material combinations, identify promising structures, and guide researchers toward the most viable candidates for lab testing.

AI struggles when data is limited, noisy, or inconsistent—which is often the case with novel materials or proprietary datasets. It also faces challenges in extrapolating beyond the training data, meaning that predictions can be less reliable for completely new material systems. 

Additionally, translating AI-generated insights into practical, scalable materials still requires deep domain expertise and experimental validation, so AI is a powerful assistant or complement, but not yet a complete solution nor a replacement for lab work.

Key Instruments for Battery Research:

1. Particle Size Analysis

Mastersizer 3000+ uses laser diffraction to provide rapid and precise measurements of particle size distributions. It is used for assessing electrode material quality, essential for problem-free manufacturing and battery performance. From optimising the flow of battery slurries, the packing density and porosity of electrode coatings, and charge rate capacity and cycling durability of battery cells – it is important to have an accurate and reliable measurement of the material particle size distribution.

The Mastersizer 3000+ features the most advanced AI and automation solutions of any Mastersizer to date. The Data Quality Guidance feature provides alerts if it detects a change from the optimal path and provides instructions to get back on track, ensuring high-quality particle size data. The SOP Architect is an intelligent method development tool designed for wet dispersion measurements. It covers all core components of the method development process, providing guidance through a standardised workflow. 

Adaptive Diffraction uses machine learning for data assessment, for more reliable sample results in challenging scenarios, such as bubbles or contaminants in the dispersant. 

The Mastersizer acquires data at 10kHz, capturing data chunks every tenth of a millisecond. Previously, this volume of data was averaged to produce a single scattering pattern, but now, machine learning allows for the processing of these individual data chunks to determine if they are in a ‘steady state’ or ‘transient state.’ 

Mastersizer Auto-Lab enables automation for the analysis of up to 45 regular samples, including three priority samples, for wet analyses. It handles sample addition, performs size measurements using a chosen method, and cleans the system in preparation for the next analysis. Smart Manager provides automated support, automatically monitoring and reporting the instrument’s performance enabling remedial action can be taken immediately when needed. 

Morphologi 4 combines the power of optical microscopy with sophisticated software algorithms to analyse and quantify particle shape (or size). Unlike traditional microscopy, which requires manual operation and analysis, automated optical imaging can capture the shape, size, texture, and distribution of thousands of particles at once. Using Morphologi 4’s fully automated image analysis capabilities, users can measure circularity, elongation/aspect ratio, circular Equivalent (CE) diameter, transparency and more for particles as small as 0.5 μm, and sample sizes from 10,000 to 500,000 particles.

In addition, with the Morphologi 4-ID, these automated static imaging capabilities can be combined with Raman spectroscopy, enabling users to simultaneously measure particle size, shape, and chemical identity on one platform aiding in the evaluation of battery material quality. 

2. Microscopy and Imaging

Phenom ParticleX elevates the capabilities of the Phenom XL Desktop Scanning Electron Microscope (SEM) with automated SEM-EDS workflows. Offering high resolution imaging combined with integrated Energy-Dispersive Spectroscopy (EDS), the system has the ability to automatically locate, study the distribution and characterise the morphology of contaminant particles in samples. 

Small contaminants in the NCM powder, for example, can jeopardise the performance, safety, and longevity of the final lithium battery. EDS enables users to identify the elemental and chemical composition of the particle in order to perform a root cause analysis of the contamination such as locating the source of the contaminant in the production workflow. 

ChemiSEM Technology simplifies EDS analysis by combining SEM and EDS functions into a single, cohesive user interface. Based on live quantification and building on decades of expertise in EDS analysis, the technology provides elemental information quickly and easily, guaranteeing reliable results in less time. ChemiSEM Technology comes with ChemiPhase. ChemiPhase identifies unique phases with a big data approach, finding minor and trace elements while eliminating user bias and reducing possible mistakes.

Phenom XL Desktop SEM offers high-resolution imaging of large sample sizes (100 mm x 100 mm) and elemental analysis (EDS) of battery materials and can include argon-filled glove boxes. This setup enables research on air-sensitive battery samples since it decreases the risk of sample degradation due to lithium oxidation. By eliminating the need to move the research sample from one instrument to another, users can retain sample integrity and save time and resources. 

ParticleX automation provides the ability to prepare sample batches to run overnight, using a step-and-repeat process to microscopically examine samples to locate, measure and classify any contaminant particles for remedial actions. Accessible via PPI (Phenom Programming Interface), a powerful method to command the Phenom XL Desktop SEM via Python scripting, the system is ideal for SEM workflows with repetitive tasks to analyse particles, pores, fibers, or large SEM images automatically.

As AI technologies continue to advance, their potential applications in scientific research, particularly in materials science, are becoming increasingly apparent. 

“In the near future, AI will become the ‘professional videographer’ for scientific researchers,” said scientists from MIT. The group recently explored the possibility of autonomously operating laboratory equipment like the Phenom desktop SEM by integrating robotics with AI. 

Experimental processes such as data collection and analysis were conducted with minimal human intervention, which allowed for continuous and efficient operation. However the automated operation of desktop Phenom SEM needed to be operated using scripting languages like Python, which restricted usage. Therefore, the group developed a voice-activated AI interface so that anyone, regardless of coding experience, could be empowered by the autonomous laboratory. 

ATA Scientific’s range of battery characterisation technologies leverage decades of analytical expertise from multiple global leading manufacturers to advance the development and performance of battery technologies. Our suite of characterisation tools and techniques addresses the critical needs of battery research, development and production, ensuring optimal performance and safety of energy storage systems.
Contact us for more information or a demo.

FAQs

  1. Can AI fully replace traditional battery R&D?

The short answer is NO – While AI can help guide researchers toward better decisions, faster,  human expertise and hands-on lab work is still required for testing, safety assessments, manufacturing and long-term performance validation. R&D involves deep experimental work—synthesising materials, testing physical and chemical properties, and validating performance in real-world conditions. These steps are critical, especially when scaling lab discoveries into commercially viable battery technologies.

  1. What’s the biggest challenge for AI in battery material discovery?

The biggest challenge for AI in battery material discovery is data quality and availability. AI models are only as good as the data they’re trained on. In battery research, there’s often a lack of large, standardised, high-quality datasets—especially for new or proprietary materials. Many experimental results are locked away in lab notebooks, published in inconsistent formats, or never shared at all. This makes it hard for AI to learn reliably or generalise beyond narrow datasets.

  1. What instruments are critical for battery analysis?

ATA Scientific offers advanced analytical instruments tailored for battery research and development, supporting advancements from material characterisation to quality control. These tools are essential for optimising battery performance, safety, and longevity. Instruments include: Mastersizer 3000+ particle size analyser,  Morphologi 4 automated imaging system, KRÜSS DSA100 Drop Shape Analyser, KRÜSS BP100 Bubble Pressure Tensiometer, Phenom XL G2 Desktop SEM, and more. 

By integrating these instruments into battery research workflows, scientists can achieve a deeper understanding of material properties, leading to the development of more efficient and reliable energy storage solutions.

References: 

Recharge Industries, Deakin University to forge AI’s role in creating better batteries – Australian Manufacturing

Advancing Asbestos Analysis in Bulk Samples with Artificial Intelligence

Harnessing the Power of AI for Automated SEM Explorations | Nanoscience Instruments

A Hydrogen Future Could be the Answer to Clean Energy

With global energy demand set to grow by about 47% over the next 30 years, the need for a sustainable energy transition has never been higher. Hydrogen is the most abundant element in the universe and can therefore become the perfect fuel for the future. 

Hydrogen fuel has the potential to transform multiple industries by reducing reliance on fossil fuels, providing a clean energy source, and enabling long-term energy storage. However, to make hydrogen fuel a truly sustainable solution, it must be produced efficiently and cost-effectively.

Hydrogen Future Key Takeaways

In this guide you’ll learn:

  • Hydrogen fuel is a critical component of the clean energy transition.
  • Advancements in green hydrogen production, fuel cell efficiency, and storage technologies are making hydrogen fuel more viable.
  • Australia is at the forefront of hydrogen fuel innovation, with research institutions and companies driving significant breakthroughs.
  • Precise measurement and optimisation of catalytic materials play a crucial role in improving hydrogen fuel cell performance.

What is hydrogen fuel exactly? 

Hydrogen fuel is a clean energy carrier that can be used for power generation, transportation, and industrial applications. Unlike fossil fuels, hydrogen can be burned or used in fuel cells with only water vapour as a byproduct, making it an ideal solution for reducing carbon emissions.

Normally the process of generating hydrogen requires electrical energy and if this energy comes from fossil fuels, emissions are be generated, which is not favourable. Alternatively Green hydrogen uses renewable energy to power the electrolyser that produces hydrogen from water.

Thus, if green hydrogen has to become the fuel of tomorrow, a technological breakthrough in terms of both efficiency as well as cost reduction is essential. The main cost of hydrogen fuel cells comes from expensive catalysts like platinum. 

To ensure maximum performance using the least amount of catalyst possible, it is important to carefully formulate catalytic inks for fuel cells and other applications. One key to maximising performance is the characterisation, optimisation, and control of the catalytic powder during synthesis when received, and during dispersion.

Australian Hydrogen Production as a Future Global Leader

Australia has an ambition to be a global hydrogen leader. Alongside renewable electricity, hydrogen will play a significant role in decarbonising our economy. 

The Australian government has awarded funding to multiple research projects to propel innovation in exporting renewable hydrogen to the world. Funding has been offered to research teams from nine Australian universities and research organisations. These include:  

  • Australian National University
  • Macquarie University
  • Monash University
  • Queensland University of Technology
  • RMIT University 
  • The University of Melbourne
  • University of New South Wales
  • The University of Western Australia 
  • Commonwealth Scientific and Industrial Research Organisation (CSIRO)

https://arena.gov.au/news/boosting-research-into-exporting-renewable-hydrogen/

RMIT University

The Sustainable Hydrogen Energy Laboratory (SHEL) leads efforts in hydrogen production, storage, and fuel cell technologies. Key research areas include developing novel methods for hydrogen production, such as direct seawater electrolysis, and exploring efficient storage solutions. 

Notably, RMIT researchers have pioneered a technique using sound waves to enhance green hydrogen production by 14 times, offering a promising approach to affordable and sustainable hydrogen fuel. 

Hydrogen is extracted from water using sound waves which eliminates the need for corrosive electrolytes and expensive electrodes like Platinum and Iridium. 

Sound waves also prevent the build-up of hydrogen and oxygen bubbles on the electrodes, which greatly improves its conductivity and stability.

UNSW

Fuel cell is a cornerstone technology for the success of Australia’s hydrogen economy, but its scalability has been stagnant for decades because of its high cost and reliance on platinum or iridium materials. 

Researchers at UNSW are working to unlock the potential of non-precious metal catalysts for hydrogen fuel cells using an interdisciplinary approach. Highly porous, multi-site single atom catalysts will be developed to block the degradation pathways, and integrated into a novel low-water retention membrane electrode assembly. 

The expected outcomes include new materials development, new cell design and a robust platinum-free hydrogen fuel cell prototype. The project will provide significant benefits to Australia in developing revolutionary hydrogen technologies.

CSIRO

CSIRO, Australia’s national science agency, has successfully demonstrated affordable and renewable hydrogen can be generated at scale to help decarbonise heavy industry after trialling its hydrogen production technology at BlueScope’s Port Kembla Steelworks in NSW.  

Unlike conventional hydrogen electrolysers, which rely heavily on electricity to split water into hydrogen and oxygen, CSIRO’s advanced tubular solid oxide electrolysis (SOE) technology uses both waste heat (for example, steam from the steelworks) and electricity to produce hydrogen with greater efficiency.  CSIRO spinout Hadean Energy has licensed CSIRO’s SOE technology and is on a mission to accelerate industrial decarbonisation.  

RUX Energy 

RUX Energy is an advanced materials company delivering breakthrough improvements in hydrogen storage and distribution. The company manufactures patented nanoporous materials and bulk hydrogen storage systems to improve the safety, storage density and cost of hydrogen storage and distribution, making green hydrogen cost-competitive with fossil fuels.

Their Micromeritics ASAP system is providing key insight into hydrogen adsorption capacity. It enables the team to conduct quick high throughput gas sorption analysis, with the capacity to degas 12 samples and run 6 samples at once on the one instrument. 

Hysata 

Hysata based in Port Kembla NSW, is an Australian manufacturer of high efficiency electrolysers developed by a team of researchers at University of Wollongong.  This green energy start up is helping to lower costs of clean hydrogen and leading the shift away from fossil fuels to power Australian heavy industry.  Hysata has developed a ‘capillary-fed’ electrolyser that splits water into Hydrogen and oxygen. In traditional designs, gas bubbles crowd the electrode, and reduce the electrolyser efficiency. Hysata’s design uses a sponge membrane to achieve direct delivery of water to electrodes and eliminates bubble formation.

Advances in Hydrogen Fuel Cell Technology with electrolysers

What are electrolysers?

An electrolyser is a device that produces hydrogen through a chemical process (electrolysis) capable of separating the hydrogen and oxygen molecules from water using electricity. Hydrogen produced in this sustainable way, i.e. without emitting carbon dioxide into the atmosphere.

Production of electrolyser and fuel cells involves carbon supported catalyst powder, which is turned into catalytic ink and coated on a proton exchange polymer membrane. Catalytic powder contains nano-sized metal catalysts embedded in porous carbon matrix. 

Catalytic ink has a complex formulation containing Pt catalyst supported on carbon black bound by the ionomer with a range of particles and their aggregates. Some alloys, such as platinum-cobalt (PtCo), are being studied with the aim of reducing their costs by lowering the amount of precious metal required to produce fuel cells. 

Particle size, particle shape, surface area and porosity in the powder and ink plays an important role in the quality of catalyst coating in terms of homogeneity, porosity and packing density. This is another important parameter for slurry stability in terms of particle agglomeration/ sedimentation, and the amount of metal catalyst loading in the powder, ink, and coated membrane.

Optimising performance of hydrogen catalysts

The catalyst’s activity and stability are the two key parameters that determine fuel cell performance. Activity is governed by the size, dispersion, and morphology of the Pt-metal group nanoparticles. 

Equally important are the structural, textural, and surface chemistry properties of the carbonaceous agglomerates during ink drying, upon deposition on the proton exchange membrane. 

The optimised pore structure of the C-support matrix can significantly reduce the amount of Pt needed, and the optimisation of its distribution and maximisation of the availability of the catalytic points for the oxygen reduction reaction (ORR) and hydrogen-oxidation reaction (HOR) in fuel cells reduces the overall cost of the process.

Advanced Measurement and Characterisation Techniques for Hydrogen Fuel Research

Catalytic activity and stability can be optimised by developing novel Pt-alloy cathode materials, controlling the particle size for maximum mass activity, controlling the inter-crystallite distance, or ensuring uniform dispersion of Pt nanoparticles on the carbonaceous support. 

Characterisation requires a range of different particle sizing techniques such as Laser Diffraction (LD) and Dynamic light scattering (DLS) to characterise particles in different size ranges.

The Zetasizer

The Zetasizer is a DLS system that can measure the size of Carbon Black in the catalytic ink. Patented Non-Invasive Back Scatter (NIBS) technology automatically adjusts the path length according to sample characteristics like opacity and concentration. 

Thus, highly concentrated, and opaque slurries like catalytic ink can be measured delivering accurate particle size across a range of concentrations and sizes whilst maintaining consistent results. 

Additionally, Zetasizer can measure zeta potential or the charge on particles. Highly charged particles will stay dispersed while low-charged particles tend to agglomerate. See our range of Zetasizer products to find out more about the advanced light scattering system. 

Mastersizer 3000+

Mastersizer 3000+ provides another way to measure the size of carbon particles particularly when agglomerates larger than 1 µm is present in the sample. 

Mastersizer 3000+ uses laser diffraction and is considered as industry benchmark for particle sizing due to its high accuracy, repeatability and reliability. Laser diffraction is fast, non-destructive, and suited for both laboratory and continuous in-line measurements.  

It  offers a wide measurement range, from 10 nm to 3500 µm, and is well suited to cover the coarse and fine agglomerates that may be present in a catalytic powder.  While measurement of powder particles in a dry dispersion is possible, it is more common to measure them dispersed in a solvent such as isopropyl alcohol (IPA).  See our range of Mastersizer products to learn more. 

Morphologi 4 

Morphologi 4 is an automated morphological image analysis system that can be used to analyse agglomerates of the C-support particles. The Morphologi 4 can image individual particles and produce a particle size distribution based on discrete particle counting within the size range of 1 to >1,000 µm.  

Particle imaging with the Morphologi 4 is advantageous because images of individual agglomerates can be retrieved, compared, and evaluated by parameters such as circularity, convexity, and roughness. The roughness of the agglomerates is important because it could affect the ease of dispersion in the ink and the formation of porosity during deposition and drying. Check our Morphologi range to find out more. 

Micromeritics ASAP 2020

Micromeritics ASAP 2020 is a flexible gas adsorption analyser capable of measuring the hydrogen adsorption capacity of powders and porous materials. It enables the hydrogen storage capacity of new materials to be quantified which is essential for predicting the performance in a fuel cell or hydrogen storage device. 

The ASAP 2020 software has been enhanced to address the needs of fuel cell and hydrogen storage researchers. This includes: 

  • Absolute pressure dosing for non-condensing probe molecules like hydrogen.
  • New isotherm reports that include the weight percent of hydrogen adsorbed and the Pressure Composition Isotherm that is frequently used by hydrogen storage researchers.
  • Calculated Free-space options to reduce analysis time, improve precision, and minimise exposure to interfering gases like helium.
Sample Preparation

Proper sample preparation is key for accurate hydrogen adsorption analysis, which is a two-step process. 

First, samples should be degassed on the preparation port to remove moisture and stray gases like CO2 that absorb strongly to many materials at ambient temperature and pressure. 

Second, the sample should be degassed thoroughly on the sample port. The standard ASAP 2020 sample tube (1/2-inch stem) with a seal frit is recommended for this type of analysis. 

An isothermal jacket is recommended if the analysis is conducted at cryogenic temperatures (liquid nitrogen or liquid argon). A filler rod is optional but not recommended if the analysis is performed at cryogenic temperatures; the filler rod may interfere with the precision of low-pressure measurements. 

In summary

Laser diffraction, Dynamic Light Scattering and Automated Image Analysis and Gas Sorption can all be effective techniques for analysing various properties of pure and alloyed Pt nanoparticles supported on a C matrix. Laser diffraction is ideal for analysing the particle size of C-support that influences the Pt dispersion and porosity in the catalytic active compound. 

While morphological imaging provides some insight into the particle size, it is valuable in providing images of individual agglomerates to enable shape analysis.

Together, these techniques enable manufacturers to optimise both the cost and performance of systems based on hydrogen technology by maximising catalyst efficiency, reducing the amount of Pt required, or developing Pt-based alloy nanoparticles.

Get in Touch with ATA Scientific

If you would like to learn more about hydrogen fuel research, advanced measurement techniques, or how ATA Scientific can support your projects, please contact us today or call us on: +61 2 9541 3500

Our team is ready to assist you with innovative solutions and expert advice tailored to your research and industry needs.

References:

Why Automated Cell Counting is Important for Modern Research

Quantifying the number and type of cells in a sample is a cornerstone of life sciences research, essential for ensuring reproducibility and accuracy across various disciplines, from fundamental biology to clinical diagnostics and bioproduction. Failing to count cells accurately or reliably distinguish between viable and non-viable cells can compromise research integrity, waste resources, and delay progress.

Traditionally, cell counting was performed manually, a process prone to human error, variability, and inefficiencies. However, with advancements in automated cell counting, researchers and industry professionals can now achieve greater precision, efficiency, and standardisation in their workflows.

Automated cell counting enables high-throughput analysis, reduces inter-operator variability, and provides critical data on cell concentration, viability, and morphology, optimising research outcomes and industrial applications. Whether working with mammalian cells, bacterial cultures, or plant protoplasts, adopting an automated approach ensures reliable, consistent results.

In this article, we explore the significance of automated cell counting, its advantages over traditional methods, and how innovations in fluorescence imaging and AI-powered analysis are shaping the future of cell research. You might even like to watch these webinars focused on cell counting and imaging.

The Challenges of Cell Counting

The process of cell counting starts with identifying the cells of interest, which can be quite diverse, ranging from cell lines to primary cells or even bacterial cells. If you are involved with fundamental research with cell lines or if you produce products in your facilities with cell lines, your needs will be different. Frequently, you can face the presence of debris, or contaminants, such as red blood cells if working with PBMCs or splenocytes for example. 

Also in the same sample you can have cells with different sizes, as is the case with Mesenchymal stem cells, (MCS) or you can encounter clusters of cells with different shapes in the same sample. 

You may be interested in counting other kinds of cells like pollen, protoplasts, sperm, spores, parasites  etc.. When working with bacteria extra challenges will need to be addressed including genome size and Brownian movements. 

How Automated Cell Counting Improves Research Outcomes


Counting cells is a common procedure in scientific experiments. Monitoring the health of your cells will check the proliferation rate, assess immobilisation, check the transfection rate or help you to seed cells for subsequent experiments especially cell-based assays. Therefore, it is critical to count cells using a reproducible approach especially if you wish to quantify measurements of cellular responses. 

Accurate counting provides quantitative and qualitative information such as concentration, viability, cell size, clustering, etc. Accurate counting will enable decisions to be made from passage to cell therapy development. 

In bioprocessing, where living cells are used to produce valuable products such as enzymes and monoclonal antibodies, process optimisation is critical. Accurate and consistent cell counting helps reduce inter-operator variability, a common challenge in research and production environments. 

Many applications demand total variability below 15%, and in some cases, even below 10%. Each step in the workflow introduces potential variability, underscoring the need for standardised, high-accuracy counting methods to improve experimental outcomes and enhance process efficiency.

Choosing the Right Automated Cell Counter for Your Needs

Over the past six decades, cell counting methodologies have evolved from manual techniques, counting whole cells in 2D in a Petri dish, to sophisticated automated systems, significantly enhancing efficiency and precision.

In addition to automated cell counters, the combination with fluorescent dyes can offer further insights that streamline and enhance the accuracy of nuclei assessment procedures, for example, in single cell genomics research settings. 

Fluorescent dyes used together with imaging tools such as automated cell counters, provide an effective method to evaluate nuclei quality and to quickly distinguish between living and dead cells. 

Measuring Cell Viability Using Fluorescent Dyes

The Acridine Orange (AO) and Propidium Iodide (PI) staining method offers a simple yet sensitive way to distinguish between living and dead cells. AO is a small molecule that can penetrate cell membranes of both live and dead cells and binds to nucleic acids/DNA to emit a distinctive green fluorescence.

In contrast, PI cannot penetrate live cell membranes – only membranes of compromised cells such as dying or dead cells. When PI is bound to DNA, it has peak excitation emits a distinctive red fluorescence. Using an automated fluorescence cell counter, green fluorescence of AO is observed in living cells, while red fluorescence of PI is observed in dead cells. AO/PI staining is therefore a useful and rapid technique for assessing cell viability.

The LUNA-FX7™ is a Game Changer in Automated Cell Counting

LUNA FX7™ can not only save time but also enhance research integrity by reducing errors associated with manual counting. Whether you are a researcher, lab professional, or a student counting cells for single-cell sequencing or dosing determination for a cell therapy, choosing the right cell counting technology is critical to ensuring accuracy and reliability. If you’re unsure which technology to use, contact us for a free consultation and we’d be happy to help you. 

Applications of Automated Cell Counting Across Research Fields


Human Cell Counting: Tackling Complexity with Precision

Whole blood is a notoriously challenging medium for traditional counting techniques aimed at enumerating a single component such as leukocytes. Platelets and mature red blood cells in particular complicate reliable counting. 

Similarly, CAR-T cell therapies require a complex biomanufacturing process entailing strict adherence to regulatory and QA/QC guidelines. Cell health and viability must be evaluated and monitored throughout bioprocessing workflows to ensure the safety, quality, and efficacy of the final clinical product. 

Key insights from recent case studies include:

  • Leukocyte and peripheral blood mononuclear cell (PBMC) Counting: The dual fluorescent LUNA-FX7™ effectively quantifies leukocytes in whole blood using high-throughput 2-channel and 8-channel slides for replicable analyses. 
  • CAR-T Cell Viability Monitoring: By employing nucleic acid stains such as Acridine Orange and Propidium Iodide (AO/PI), researchers can monitor CAR-T cell health during biomanufacturing. The LUNA-FX7™ meets rigorous QA/QC guidelines through the use of pre-set validation slides, internal QC software, and optional 21 CFR Part 11-compliant software.
  • Automated QC of Isolated Nuclei:  accurate evaluation of nuclei quality is pivotal for single cell genomics research. Combining fluorescent dyes (AO/PI) with imaging tools such as automated cell counters like the LUNA-FX7™ and LUNA-FL™, provides an effective method to evaluate nuclei quality.

Animal Cell Counting: Supporting Biotechnology and Veterinary Research

Monitoring the concentration and viability of animal cells is integral to a whole hostof workflows covering areas such as livestock health, fertility assessment and cell biotechnology for protein production. 

Traditional flow cytometry-based methods can be costly and require large sample volumes, whereas the LUNA-FX7™ offers a more accessible and cost-efficient alternative.

Highlighted applications include:

  • Somatic Cell Counting in Milk: Fat and protein debris complicate somatic cell count (SCC) determination, but using the LUNA-FX7™ with Somatic Cell Staining Solution enables accurate cell counting.
  • SF9 Insect Cell Viability: In protein production workflows, selecting appropriate dyes and exposure settings ensures optimal SF9 cell quality assessment.
  • Cattle Sperm Cell Analysis: A comparative analysis of fluorescent dyes allowed for optimised sample dilution and imaging conditions, ensuring precise fertility evaluations.

Plant Cell Counting: Immediate Viability Assessment for Protoplasts

Traditional methods for assessing the viability of plant protoplasts – plant cells with removed cell walls – require culturing until the protoplasts have developed into complete plants, making viability determination time-consuming. 

The LUNA-FX7™ overcomes this challenge by enabling immediate assessment using double-staining with distinct-coloured fluorescent dyes. Researchers have successfully identified optimal dye combinations and parameters, allowing for reliable and rapid viability assessment, streamlining workflows in plant biotechnology and genetic engineering.

Innovations in Automated Cell Counting: Embracing AI and Machine Learning

Cell counting remains an essential process across fundamental research, clinical applications and bioproduction. As science continues to advance, there is a growing demand for faster, higher-throughput, and more tailored cell counting solutions. While automated techniques address many of these demands, challenges including sample prep, technology compatibility, cost efficiency, and compliance remain. 

Recent innovations in software and hardware, including the integration of artificial intelligence and machine learning, focus on enhancing accuracy and efficiency in cell counting. For instance, the new LUNA-III™ cell counter utilises machine learning algorithms to ensure high-quality and reliable results, addressing current cell counting challenges and providing practical solutions for applications such as CAR-T cell therapy production and single-cell sequencing.

Selecting the appropriate cell counting technology is crucial for research success. Factors to consider include sample preparation requirements, technology compatibility, cost efficiency, and compliance with regulatory standards. 

Automated systems like the LUNA-FX7™ and LUNA-III™ offer advanced features that cater to these considerations, providing researchers with tools to enhance accuracy, efficiency, and reproducibility in their workflows.

Are you ready to upgrade your lab’s cell counting capabilities? Explore how the LUNA-FX7™ and LUNA-III™ can transform your workflows and enhance research outcomes today!

Contact us for a demo!

Reference: SelectScience releases exclusive Application eBook for cell counting accuracy and efficiency – Logos Biosystems | Advanced Imaging Solutions for Research Excellence

Precision Engineering nanoparticles for drug delivery

“This is where formulations come to die!” These are words of a prominent pharmaceutical company GMP formulations lead. What makes this so difficult? How can a formulation go this far before falling over? Presumably there have been extensive clinical trials, yet as soon as scaling is called for something fails. What makes a winning formulation? This article will explore some key points to consider when formulating medicinal products, predominantly for in vivo injection. 

Many years ago, at a conference in Chicago, a pharmaceutical company representative asked advice on how to analyse a tablet post digestion – because they ‘had no idea what really happens to their oral medications once swallowed’. This sent me into a spin… Since then, I have sought alternatives for drug delivery.

Intravenous (IV), subcutaneous (SC), and Intramuscular (IM) routes help reduce the actives’ concentration requirement plus preserves the payload from the oral degradation. They enjoy a rapid onset of action, are apparently a predictable way of action and almost complete bioavailability. Given the nature of the payloads considered, this chapter will focus on routes other than oral.

How do we encapsulate nanomedicines for targeted delivery

Common reasons to encapsulate Protein, peptide, RNA, or small molecules are many, such as to protect the payload and to facilitate cellular uptake. Other proposed uses include the incorporation of a ‘decoration’ to guide the nanoparticle to a particular target, though there is little evidence of this being very specific. Novel nanoparticles looking at changes in structure and constituents are increasingly being employed. Importantly a nanocarrier will reduce systemic toxicity, reduce concentrations of the payload required, and protect a payload from premature biological degradation. 

How can we currently encapsulate?

Over the years there has been a dramatic increase in microfluidic devices from an array of companies attempting to cash in on the explosion of research, particularly with RNA of one flavour or another.
I think it was Harry Truman who stated, “If you can’t convince them, confuse them”, I aim to demystify this expanding world and hopefully bring clarity to this confusion.  If you invest time in reading the white paper https://www.atascientific.com.au/a-better-way-to-create-nanoparticles/ you will find a discussion about an array of microfluidic devices, how they work and the limit of their uses. To expand, this document relates to the formulation itself and its interaction with mixer employed. 

Formulation as a function of prevailing technology

Many companies and research institutes invest a deal of resources formulating a lipid construct that will not only encapsulate the required cargo but mix well to elicit the targeted size and Poly Dispersity Index. This is the current paradigm. Unfortunately, each mixer has a peculiar method where, at times, the formulation fails with orthogonal technologies or fails to scale efficiently. Some organisations invest in low-cost T Mixers or similar only to learn that they need to spend enormous human resources to develop a formulation to efficiently produce poultry volumes. In the Australian parlance, this is an apt descriptor for “the tail wagging the dog”. Ideally the most versatile technology would be one that has the capacity to morph to a formulation. 

If I had a winning formulation, I would be reticent to modify it for a mixer. I recall a conversation I had with the Director of CMC in a Canadian therapeutics’ organisation, he stated “We make exceptional formulations; You just have to mix it”. Whilst it sounds flippant, he was prompt to add, the technology we presented was adept at transforming to suit any given formulation, indeed in “two runs” we had nailed a formulation they had to tweak for 6 months on another technology.

It is becoming increasingly clear that formulations may be stymied by the technology employed. The inflexibility of many microfluidic devices coupled with the abject failure to scale is concerning. The lure of an easy fix or popular choice of peers may in fact limit the very research you wish to expand, not only in terms of expense, time, and resource but opportunity. Many formulations are likely to have failed as they approached the limit capacity of the employed mixer.  Following the golden rules of nanoparticle creation- mixing rate must be faster than assembly rate.  

Nanoprecipitation can be tuned with changes to flow rate and the flow rate ratio of the two phases mixed. Well, this is the case with most instruments, what if you can make minor modifications of the technology to enhance the creation of bespoke formulations, potentially turning what was thought to be marginal into a lead candidate. In the discussion below about PEG alternatives, I pondered their acceptable results and wondered what if these were a function of the technology limit- not the lipid’s limit? Frequently I have run formulations where microfluidics yield Encapsulation Efficiency (EE) of around 80– 90% – acceptable? Not really as I approach 99 – 100% on the exact same formulation. 

Quality of nanoparticles

Assessing the apparent quality of a nanoparticle is interesting! To what measure or standard?
The current theory starts with Dynamic Light Scattering with the gold standard system – the Malvern Panalytical Zetasizer, analysing the Size, Poly Dispersity Index (PDI) and ZetaPotential. The next question is the Encapsulation Efficiency (EE) a measure of how much of the payload eg API or RNA is actually held within the construct of the nanoparticle. Ideally it is as close to 100% as possible as the cost of some payloads are significant, where every 1% reduction in EE will have dramatic effects on total costs of production. – if you are not encapsulating you are virtually flushing away the expensive RNA. There needs to be more research into analytics of the payload particularly what is the effect on the payload once it is encapsulated into a nanoparticle? Such needs are heightened should multiple APIs be encapsulated within the same nanoparticle, what interactions occur? Some interesting research into this arena with RNA is occurring with the advent of Microfluidic Modulation Spectroscopy, a technology capable of elucidating protein structure. Recently an enhancement enabled easy detection and comparison of RNA changes that are vital for therapeutic development, and here is the kicker – within an LNP.

Checking the in-vivo capabilities of the particle is where ‘the rubber hits the road’. Understanding transfection, bio-distribution and efficacy is the next level of assessment. Clearly this will define the effectiveness of the delivery vehicle and the payload as well. A long-held debate has been whether the murine model is a valid measure. A recent paper from the University of British Columbia (UBC) has some interesting findings with a porcine model1, demonstrating “… that following a low-dose infusion of mRNA-LNP, exogenous protein and exogenous mRNA transcripts can be detected globally including in the liver, spleen, lung, heart, uterus, colon, stomach, kidney, small intestine, and brain of the swine. Notably, we also detected exogenous protein expression in the bone marrow, including megakaryocytes, hematopoietic stem cells (HSC), granulocytes, and in circulating blood cells such as white blood cells and platelets.”1 It has, in the past, been widely accepted to attain extrahepatic targeting employment of a specialised moiety decorating the surface of a Lipid NanoParticle (LNP) is required, perhaps this may not be a necessity. 

Not all Lipids are equal

The complexity of formulation does not end with the achievement of appropriate particle size, PDI, zetapotential and EE. Even with an EE of 99% the question remains whether there is adequate cellular uptake, does the payload release where intended, is it taken up by the intracellular organelles targeted, what happens in endosomal escape? Most of these are poorly understood. Screening of a lipid candidate can include biodistribution studies where expression of a fluorescent marker is tracked by imaging, or alternate methods. Perhaps it is the formation of antibodies that define success. “Despite the developments in the LNP field, a commonly overlooked aspect regards the very limited release of the nucleic acid payloads in the cytoplasm10.”

“The highly dynamic nature of endosomal compartments and shared markers between them adds another layer of complexity making it even more difficult to gain common conclusion regarding trafficking and escape of LNPs. Nevertheless, endosomal escape is one of the most important aspects for efficient nucleic acid delivery, and it is also pertinent to pay attention to the requirement of sophisticated tools and probes to understand the basic molecular biology of this process10.”  

Lipids may not be equal, neither are the payloads and their purpose. It has been noted that there are many lipids that combine to form an LNP, as Robin Shattock’s group11 reports, the helper lipid selection can have a significant role.  They noted ‘helper lipid identity altered saRNA expression’ and ‘LNP storage’. Confirming formulation is a richly diverse field with a great deal to contribute to medicine. 

It may not be just about vaccination or chasing a tumour, it may be as fundamental as enabling better platelet transfusions. Exciting research at UBC has succeeded in transfecting platelets with mRNA via an LNP, to ‘enable exogenous protein expression in human and rat platelets’12. It is thought to be the first instance of this and could possibly expand the therapeutic potential of platelets. 

Alternate Formulations

Metal-phenolic networks (MPN) are offering another indication there could be alternatives to the current paradigm. The Caruso lab in Melbourne University have developed a method to create MPN Nanoparticles2 in not only a straightforward reproducible, but tunable manner. “We demonstrate the role of buffers (e.g., phosphate buffer) in governing NP formation and the engineering of the NP physicochemical properties (e.g., tunable sizes from 50 to 270 nm) by altering the assembly conditions. A library of MPN NPs is prepared using natural polyphenols and various metal ions. Diverse functional cargos, including anticancer drugs and proteins with different molecular weights and isoelectric points, are readily loaded within the NPs for various applications (e.g., biocatalysis, therapeutic delivery) by direct mixing, without surface modification, owing to the strong affinity of polyphenols to various guest molecules.2” This is hugely impactful work with global implications. Well worth following this lab for the exciting things to come. 

Polysarcosine lipids – PEG alternative

Lipid nanoparticles (LNPs) such as ALC-0315 and SM-102 LNPs have been applied to deliver mRNAs encoding viral antigens against the SARS-CoV-2 virus. These LNPs are typically comprised of four distinct lipid components: ionizable lipids, phospholipids, cholesterol, and polyethylene glycol lipids (PEG lipids)3. Prior to the COVID Pandemic there were studies evaluating the prevalence of pre-existing anti-PEG antibodies4. The use of this lipid construct across the globe to vaccinate billions of people prompted over a dozen studies regarding anti-PEG antibodies occurrence, defining which immunoglobulin was triggered and resultant allergic responses. As reported by Kang3 the results were conflicting. Despite the inconclusive nature of these studies, there is a growing appeal for alternatives to PEG.  Kang3 evaluated a panel of polysarcosine (pSar) as a direct replacement to PEG in the ALC-0315 and SM-102 based LNP formulations with comparable physicochemical properties perhaps even enhancing mRNA delivery efficiency in-vitro and in-vivo along with overall immunogenicity. Interesting developments that may assist all LNPs. 

Poly-lactic-co-glycolic acid (PLGA)

PLGA are a family of FDA-approved biodegradable polymers that are physically strong and highly biocompatible and have been extensively studied as delivery vehicles of drugs, proteins, and macromolecules such as DNA and RNA6. Over the years there have been few more enduring materials in drug delivery research with such a wide range of applicability than that of Poly-lactic-co-glycolic acid (PLGA). Such a wonderful biodegradable polymer that essentially breaks down to Lactic and Galactic acids and ultimately CO2 and H2O eliminated by the human body through a natural pathway such as the Krebs cycle. As diverse as the applications, so are the methods to create PLGA particles, such as Spray drying, Microfluidics and nanoprecipitation with lipids to name just a few. Most methods struggle to create enviable polydispersity and volumetric yield. The methods are laborious and difficult to scale. A solution to this is the Advanced Cross Flow (AXF)5 where Membrane emulsification operates in a controlled low shear environment, bringing the advantages of microfluidic mixing to the commercial scale. By substantially reducing the energy input membrane emulsification dramatically improves particle size distribution when compared to traditional batch homogenization. The result is a more consistent product that is not lost to downstream filtration. 

Moreover, AXF technology operates continuously, enabling real time process monitoring and feedback control during drug product manufacturing. A simple change to the membrane tunes the system to produce either nano or Micron sized particles. One installed system has been configured to create 10 Kg of PLGA particles per day, dispelling the fear of lack of yield. In a search Aug 2024, of ClinicalTrials.gov (https://clinicaltrials.gov/search?term=PLGA&intr=PLGA ) there were 43 with PLGA particles.

Freeze dried lyophilised 

Whilst not strictly a novel formulation method, freeze drying is interesting as a delivery vehicle for other formulations. Powdered forms of nanoparticles could be highly efficient nasal delivery systems.
“The lung is directly exposed to the outside environment through the airways. It contains two main functional parts, the conducting zone (trachea, bronchi and bronchioles) and respiratory zone (alveoli). The top five most common lung diseases causing severe illness and death worldwide include tuberculosis, respiratory infections, lung cancer, asthma and chronic obstructive pulmonary disease (COPD), which together have a huge global burden7.” Imagine the global health significance of a loaded LNP, freeze-dried and delivered by inhaler direct to the lungs. Sending anything into the lungs is not as simple as it sounds. Consider that at its core, the lung is a site for gaseous exchange, but unfettered access would expose the body to innumerable airborne pathogens.

 Evolution has armed us with some formidable defenses such as a wash of antimicrobials, mucus, neutralising immunoglobulins, beating cilia and an epithelial cell layer. These are bolstered by white blood cells. This is why packaging the drug to move by stealth enhances the success of treatment.

Liquid Crystalline Nanoparticles (LCNP)

Distinctive structural features of lyotropic nonlamellar liquid crystalline nanoparticles (LCNPs), such as Cubosomes and Hexosomes enhance their applicability as effective drug delivery systems. “Cubosomes have a lipid bilayer that makes a membrane lattice with two water channels that are intertwined. Hexosomes are inverse hexagonal phases made of an infinite number of hexagonal lattices that are tightly connected with water channels. These nanostructures are often stabilized by surfactants. The structure’s membrane has a much larger surface area than that of other lipid nanoparticles, which makes it possible to load therapeutic molecules. In addition, the composition of mesophases can be modified by pore diameters, thus influencing drug release8”. This method has the potential for a kind of repackaging of existing medications for more efficient and effective delivery.
In context- antimicrobial drugs may be able to pass into cells, therefore the previously unreachable intracellular bacteria can be treated. Consider chronic lung infections. An example of how effective this is was the subject of a study at the University of South Australia, ´The ability of a cationic LCNP to improve the performance of antibiotics against intracellular bacteria present in macrophage and epithelial cells was determined. The presence of DDAB altered the morphology of LCNPs into an onion-ring like structure. The inclusion of a cationic lipid enhanced cellular uptake, >50% and > 90% in macrophages and epithelial cells, respectively. In macrophages, LCNP-DDAB reduced intracellular P. aeruginosa and S. aureus viability by ∼ 90% and ∼ 55% at 4x MIC of antibiotics.9

Looking toward the future of nanoparticle formulation

Will there be one magic bullet or horses for courses approach? If history boasts a rich tapestry of methods for drug delivery, the future is sure to be exciting. This review is not definitive, it is moreover a snapshot of a few prevalent procedures in a constantly evolving environment.

The creation of nanoparticles has nuances, being able to pivot to these with a flexible technology will likely be the successful combination going forward. Microfluidic devices have challenges when called upon to scale up despite the promise of a limited interventionary technique. Their failure has prompted a paradigm shift to a novel method of nanoparticle production, the Micropore Technologies Advanced Cross Flow systems are a solution with ample flexibility to take you from 200 ul R&D samples to thousands of litres in GMP production using the same technology in R&D as in GMP without being formulation centric.  Whilst not a panacea for all delivery goals, this technology sure has legs for the lions’ share.

References

  1. ´Protein is expressed in all major organs after intravenous infusion of mRNA-lipid nanoparticles in swine’ Ferraresso et al 2024 Molecular Therapy: Methods & Clinical Development https://doi.org/10.1016/j.omtm.2024.101314
  2. ‘Direct Assembly of Metal-Phenolic Network Nanoparticles for Biomedical Applications’ Xu et al. Angewandte Chemie International Edition https://doi.org/10.1002/anie.202312925
  3. ‘Engineering LNPs with polysarcosine lipids for mRNA delivery’ Kang Et Al, Bioactive Materials 37 (2024) 86-93. https://www.ncbi.nlm.nih.gov/pmc/articles/PMC10957522/pdf/main.pdf
  4. Analysis of Pre-existing IgG and IgM Antibodies against Polyethylene Glycol (PEG) in the General Population Yang . Q. Et Al Anal Chem. 2016 Dec 6;88(23):11804-11812.
    doi: 10.1021/acs.analchem.6b03437. Epub 2016 Nov 16.
  5. ‘Polymeric Encapsulation of Active Pharmaceutical Ingredients’ https://microporetech.com/applications/biodegradable-polymeric-materials
  6. ‘PLGA-Based Nanomedicine: History of Advancement and Development in Clinical Applications of Multiple Diseases’ Alsaabet Al, Pharmaceutics. 2022 Dec; 14(12): 2728 https://www.ncbi.nlm.nih.gov/pmc/articles/PMC9786338/
  7. ‘Lipid Nanoparticles as Delivery Vehicles for Inhaled Therapeutics’ Leong et al Biomedicines. 2022 Sep; 10(9): 2179. doi: 10.3390/biomedicines10092179
  8. ‘Recent Advances in the Development of Liquid Crystalline Nanoparticles as Drug Delivery Systems’ Leu et al Pharmaceutics. 2023 May; 15(5): 1421.
    doi: 10.3390/pharmaceutics15051421
  9. ‘Liquid crystalline lipid nanoparticles improve the antibacterial activity of tobramycin and vancomycin against intracellular Pseudomonas aeruginosa and Staphylococcus aureus’ Subramaniam et al International Journal of Pharmaceutics Volume 639, 25 May 2023, 122927, https://www.sciencedirect.com/science/article/pii/S0378517323003472#b0240
  10.  ‘Endosomal escape: A bottleneck for LNP-mediated therapeutics’ Chatterjee et al; PNAS March 2024: https://doi.org/10.1073/pnas.2307800120
  11. ‘The role of helper lipids in optimising nanoparticle formulations of self-amplifying RNA´ Barbieri et al; Journal of Controlled Release Volume 374 , October 2024, Pages 280-292 https://doi.org/10.1016/j.jconrel.2024.08.016
  12. ‘Genetically engineered transfusable platelets using mRNA lipid nanoparticles’ Leung et al;
    Sci. Adv. 9, eadi0508 (2023), Downloaded from https://www.science.org on September 02, 2024

5 Reasons Why Zetasizer Is Still The Most Widely Used Dynamic Light Scattering (DLS) System

Dynamic light scattering (DLS) is now a ubiquitous tool in many laboratories, and offers an accessible and accurate way to determine hydrodynamic size distribution in minutes. The non-invasive technique requires very little sample and is quite easy to use for a range of user abilities. 

The newly released Zetasizer Lab, Pro and Zetasizer Ultra are the latest editions to the Zetasizer range. Adding ease and performance to the popular Zetasizer Nano range, they offer unique updated measurement features, hardware capabilities and software intelligence that are unmatched. In this article we deep dive into the top 5 features and updates of the Zetasizer Pro and Ultra systems and share some insights into how you can get the most out of your DLS instrument – and your analysis.

An overview: how DLS technology works

In DLS, the speed at which particles diffuse due to Brownian motion is measured. This is done by shining light directed to a sample contained in a cell. For dilute samples most of the laser light passes through the sample but some light will be scattered by particles in all angles. A detector is used to measure the intensity of the scattered light. In the Zetasizer advanced series, the detector position will be either at 173° (non-invasive backscatter) or 90° (side scattering) or 13° (forward scattering). 

The intensity of scattered light must be within a specific range for the detector to successfully measure it. If too much light is detected, then the detector will become saturated. To overcome this, an attenuator is used to reduce the intensity of the laser source and hence reduce the intensity of scattering. For samples that do not scatter much light, such as very small particles or samples of low concentration, the amount of scattered light must be increased. In this situation, the attenuator will allow more laser light through to the sample. 

The scattering intensity signal from the detector is passed to a correlator which compares the scattering intensity at successive time intervals to derive the rate at which the intensity is varying. This correlator information is then passed to the Zetasizer software to analyse the data and derive size information.

Zetasizer is the standard in light scattering for over 40 years

What sets the Zetasizer apart for other similar systems is the performance, reliability and ease of use. Over 40 years ago, the Malvern correlator opened doors to a field of research and development investigating ever smaller particles, and continuously advancing since then. Since first launched over 2 decades ago, the Zetasizer Nano series has been the standard for performing dynamic light scattering (DLS) measurements on a wide range of particles and materials. The Zetasizer Nano was the first system that combined dynamic, electrophoretic and static light scattering in one instrument. Zetasizer quickly gained well-deserved attention with core features including fast, simple-to-use, yet sophisticated software with built in guidance. Most significantly, Zetasizer is known not only for its ability to provide the highest sensitivity but also the widest concentration range from the then novel Non-Invasive Back Scattering (NIBS). NIBS reduces the effect known as multiple scattering where light from one particle is itself scattered by other particles by moving the focusing lens and changing the measurement position. In this way light passes through a shorter path length of the sample, allowing for higher concentrations and turbid/opaque samples to be measured.

The need to clarify, NIBS and Backscatter are not the same

NIBS is one of the key features with unique functionality that separates the Zetasizer from other DLS systems. The patented NIBS technology enables the highest sensitivity for both small and large particles even for the most concentrated samples. This unique ability to perform at the highest level no matter the application has resulted in the Zetasizer Nano being the most popular instrument for sizing by DLS, with over 100,000 peer-reviewed publications.

DLS has traditionally used 90 ° detection angles. Adding a backscatter angle provides several benefits allowing for higher sensitivity and a higher size range with increasing volumes. Backscatter measurements are also less sensitive to large particulates such as dust, removing the need for time consuming sample preparation traditional 90° measurements require. However, the benefits of backscatter come with compromises; increased volume reduces the high concentration range, increased flare creates more noise and a reduced sensitivity may be unable to detect the presence of important aggregates. 

These are overcome in the Zetasizer using NIBS at a detection angle of 173°. For aggregate detection, a forward angle of 13° is employed to detect the presence of aggregates at much lower concentrations (with higher sensitivity) than backscatter or 90°.

NIBS and automatically determines the optimum measurement position within the cuvette and correct attenuation of the laser for the sample being measured. When analysing very low concentrations or weakly scattering particles, NIBS automatically positions the detector optics at the center of the cell to maximise the scattering volume. As the concentration or scattering intensity increases, it avoids multiple scattering by moving the optics across the cell in small increments. At high concentrations the optics will be positioned at the cell wall, reducing the path length and therefore minimising multiple scattering. This together with the attenuator, which automatically adjusts to ensure the optimum amount of light is used, ensures that no matter what the concentration, size and scattering efficiency, the optimal results are reached covering the broadest range of applications. These features make NIBS unique, providing extremely useful functionality unavailable on other instruments (even those using back scatter detection).

New Zetasizer Advance series – top 5 features

The Zetasizer Ultra has multiple features that help to reduce the time taken for measurements while providing much more detail on sample properties.

  1. Faster size with Adaptive Correlation (AC), and better size data. It takes less time to make a measurement. You can also get data from samples that were too noisy before.

Adaptive correlation is a new approach for capturing and processing DLS data. It uses statistical models to highlight any captured data that is not representative of the sample such as rare dust particles. Multiple short sub runs are performed and the resultant correlation functions are averaged to reduce the effects of noise. AC allows the characterisation of consistent and steady size components without data being skewed by intermittent or transient scatters. In this way, the measurements can exclude effects of dust while also increasing measurement speed and repeatability. There is also less need for filtering of samples and dispersants, simplifying sample preparation procedures. 

  1. AI guided, neural network help with size data quality advice: Even a novice without any prior light scattering knowledge can make sense of sizing data.

The new ZS Xplorer software offers intuitive, guided workflows that make setting up a method and performing a measurement easy and straight-forward. Using an artificial intelligence (AI) led approach to data quality assessment, it brings attention to any potential measurement issues and provides guidance on how to improve them.

  1. Fluorescence filter wheel allows for measurement of fluorescent samples which can cause large background noise in the data. The fluorescence filter eliminates that noise and makes a measurement possible despite the presence of fluorescence. 

For fluorescent samples like quantum dots, light emitted by the sample other than laser scattering will decrease signal to noise. The Zetasizer has an option that can minimise the effect of (incoherent and thus undesirable for dynamic light scattering) fluorescent light: the fluorescence filter eliminates most light that is not very close to the laser wavelength. The fluorescence filter is an optical component consisting of glass with a special coating to reflect light outside the designated wavelength range. Therefore it only allows a select wave length range for transmission.

  1. Polarisation filter, both vertical and horizontal polarisation components can be detected, potentially gaining insights into particle rotational diffusion.

Adding a polarising filter can clean up the optical signal by removing any depolarised light which can be a source of noise in measurements caused by multiple scattering. This feature provides versatility to measure over a wide concentration range, improving signal-to-noise without impairing overall system sensitivity. In addition to a vertical polariser, the Zetasizer Pro and Ultra have a horizontal polariser which measures depolarised light. A depolarised DLS signal can be used to detect rotational diffusion which indicates differences in particle shape and whether particles are spherical or have surface differences.

  1. Novel 3uL low volume size cell, lowers sample volume and extends concentration range for 90 degrees: You can measure even turbid samples now at 90 degrees, which was previously not possible and required NIBS backscattering. 

As particle size increases, thermal Brownian motion is no longer sufficient to keep particles in suspension, and samples may sediment over time, meaning that the motion of the particles is no longer random. In addition measurements of particles over 1 micron in size may show some difference in variability as a function of temperature, suggesting that thermal effects may influence the artefacts seen in the measured correlation functions. The geometry of the 1mm capillary used in the low volume disposable sizing cell helps to prevent the formation of convection currents and thus allows accurate measurements without modification of the sample dispersant over the entire measurable size range for DLS. Repeatability for polydisperse samples is improved over comparable measurements in a standard cuvette.  The cell also eliminates the errors associated with multiple scattering, allowing samples to be measured over a wider dynamic concentration range than would normally be possible at side scatter (90°).

Contact us for more information or to book a demonstration with one of our specialists.

Additional resources

Next Generation LNP Manufacturing

Ease of scalability

Producing COVID-19 vaccines for the entire world population rapidly demonstrated the microfluidic development scale up roadblock. Discovery formulations developed using microfluidics had to be scaled up using alternative higher throughput formulating technology with different operating parameters.   

With a growing demand for more mRNA-LNP based vaccines, proven to have high efficacy, there is currently a need to facilitate a faster and cheaper global deployment of a high-throughput manufacturing method. A GMP compliant approach is needed, from the earliest possible stage through to manufacturing, that is also tuneable in size to access various tissues or specific drug targets.  

Advanced cross flow mixing (AXF) from Micropore Technologies allows for seamless scaleup with consistent physics, mechanisms conditions and geometry across its equipment range. Ultimately Micropores AXF technology can be scaled up to a device with over 10 million pores with the potential for a throughput of up to 20 Liters per minute all this from a device that would still fit inside a briefcase. AXF allows controlled, low shear precision continuous flow mixing technology from nano to micro formulations for when you want to avoid roadblocks on your product development journey. It uses the same same shear, same physics and same technology from lab bench to manufacturing scale to enable scale up with confidence.  

Micropore technology address key concerns for adoption

  • Expertise, availability of skilled personnel, associated risks, and the need for a reliable supply chain. 

Micropore is a technology provider with global experience in manufacturing all different types of vaccine modalities can further ensure a cost-effective, high-quality process. Partnering with Micropore will enable a stronger benchmark with in-depth expertise and the ability to leverage novel technologies will also help reduce risk and shorten timelines.

  • There is a need to develop standard analytical methods for quality characterisation and reference material that lend insight into the mechanisms of stability or degradation of mRNA and LNPs containing it. 

The determinants of stability of mRNA in LNP formulations – what parts are predicated on the payload of mRNA and what portions are predicated on the lipid nanoparticles themselves or what portions are predicated on the freeze-drying cycle that’s used – can be related to its size and its secondary structure. Messenger RNA poses a unique manufacturing challenge because of its large size. Other RNA entities such as siRNA and guide RNA for clustered regularly interspaced short palindromic repeats (CRISPR) technology typically are produced using chemical synthesis, which can be performed in a relatively controlled environment. But mRNAs are larger, with complex three dimensional structures that aren’t yet fully understood. Malvern Zetasizer (DLS) enables particle size and stability measurements while the RedShiftBio Aurora (MMS) system enables secondary structure (HOS) determination.

  • The need to move to larger scale manufacturing of mRNA-LNPs without an extensive setup or excess capacity to convert.

With mRNA vaccine production requiring relatively less space than other approaches, new facilities may be more feasible and affordable. Micropore technology can enable localised production of vaccines and thus accelerate access to a much larger population. In locations with limited or no infrastructure, the Micropore approach can be the shortest route to production and can reflect the exact needs of the organisation at minimal cost.

  • The need for future vaccine manufacturing facilities to be closed and continuous processing, plus equipment connectivity and communication.

Micropore offers a minimal cost model achieved through the AXF advanced cross flow technology platform. The flexibility of mRNA-based vaccines when manufactured using this single piece of stainless steel equipment with no consumables means it requires the least capital investment. The scalability of production (from 200 μL to 1500 L/hr) reduces the facility design complexity and means that more doses can be manufactured in a continuous process which eliminates variability, compared to a batch-to-batch approach. As such, this vaccine modality combined with the Micropore mixing platform can be a robust starting point for production with low risk.

  • The need to overcome current barriers of manufacturing process to be fully digitalised as regulatory authorities rely on data and parameters recorded during production for verification and approval.

Micropore cross flow technology demonstrates predicable scalability which is favourable especially for GMP manufacturing which means process controls can be introduced that are automated – process analytical technologies (PAT). Automated analysis of properties such as online particle size enables the option to automatically control any deviations in size and feed that back to control the pumps and optimise control to give the correct size again. This increases confidence in quality of production meaning throughput can be increased further.

Continuous Formation & Stabilisation of LNPs Minimises Risk of mRNA Degradation

Batch mode vs continuous mode manufacturing: While Impingement jet mixing (IJM) or T-mixers are the most widespread manufacturing method currently, high turbulent mixing combined with high pressure and shear stress effects can compromise LNP stability and affect overall performance of the product. The process also suffers from high batch variability and high wastage due to holding or prolonged processing steps.

Micropore technologies advanced cross flow mixing device for manufacturing LNPs at scale.

Micropore Technologies offers Continuous Manufacturing: Micropore Technologies employs laminar flow mixing across a permanent stainless-steel membrane to produce reproducible, scalable LNPs. The outer dispersed phase is continuously mixed with the aqueous inner compartment to form LNPs. Size controlled uniform particles are generated in a continuous flow capacity of up to 1500 L/hour making this by far the fastest production rate in the LNP industry. This would translate to roughly 58,000 doses of vaccine every minute, an important capability when faced with the demands of global disease emergencies. 

Micropore Technologies: 2nd generation Vaccine manufacturing Process

Micropore technologies advanced cross flow mixing device for manufacturing LNPs at scale.

Micropore’s Membrane Technology: How it works

Micropore’s equipment is uniquely suited to the production of complex nanomedicines in a scalable manner – from small 200µl samples through to 1 billion doses.

Micropore technologies differs from conventional mixing LNP techniques by considering the process not as discrete or separate unit operations but as one single whole process.

Micropore technologies advanced cross flow mixing device for manufacturing LNPs at scale.

Attributes:

• High efficiency, scalable and reproducible.

• Reduced manufacturing time and costs.

• Customisation for diverse LNP formulations.

• Tunable particle size with narrow size distribution (PDI).

The Micropore system comprises a membrane inside a housing. Lipid mixtures added from the top are mixed with the RNA/buffer solution from the side which enters the membrane to produce monodisperse particles.  The system operates at very low pressure – approximately 2 Bar. This allows the size of the particles created to be very predictable with any change in flow rate. T-mixer devices operate at much higher pressures – about 30 Bar.

Micropore technologies advanced cross flow mixing device for controlled manufacturing LNPs at scale.

The graphs above show comparison control curves for AXF vs. T-mixer.

Advanced Cross Flow (AXF) mixing

Micropore technologies advanced cross flow mixing device for manufacturing LNPs at scale.

Micropore’s equipment is uniquely suited to the production of complex nanomedicines in a scalable manner – from mL batches up to tonnes.

A lipid/organic phase passes through the 100,000s of membrane pores into the flow of aqueous continuous phase that passes through the centre of the membrane tube. Gentle, laminar flow based mixing allows for good preservation of sensitive materials. Precision engineered equipment gives great size distributions even at scale, allowing precise targeting of distributions.

Micropore technologies advanced cross flow mixing device for manufacturing LNPs at scale.

Process robustness and high encapsulation efficiency

Here we present data from a formulation prepared using the AXF Pathfinder 20.

The conditions used are listed below:

  • Formulation ratio DDAB:DSPC:cholesterol:DMS-PEG2000, 40:10:48:2 mol%.
  • Lipid concentration, 3.5mg/ml
  • N:P ratio, 1:6
  • polyA concentration, 0.046mg/ml
  • Flow rate ratio 3:1
  • Total flow rate 100mL/min
  • continuous phase, Tris buffer, 10mM pH 7.4

The Pathfinder delivered highly repeatable, monodisperse LNPs that were 70nm in size with a narrow PDI of 0.13. The experiment was repeated in triplicate and samples were measured using the Malvern Zetasizer DLS system.

Encapsulation efficiency is about 97-98%. The AXF mini uses cross flow mixing which is a gentle mixing technique and prevents RNA degradation.

Process tunability and predictability

The two graphs above demonstrate the superior capability of the AXF mini to control the size of nanoparticles produced which can be critically important, especially for GMP manufacturing.

The plot on the right shows two formulations, plotted in red and green. Differences arise from e.g. concentration of DMG-PEG200 in the range 0.004 – 0.12 μmol which reduces size from 200 nm to 30 nm but both exhibit the same shape and therefore control. Although the PDI is still quite tight in both formulations but the formulation plotted in green is considerably larger (100-160nm) compared to the formulation in red (50-110nm). From this experiment you can quickly see it is possible to produce a 70nm particle by using a total flow rate around 100 ml/min. 

The plot on the left shows an experiment where the AXF mini was used to create two different formulations using two different flow rates. At 20ml/min the LNP size was 107 nm. When the total flow rate was increased to 200 ml/min, the LNP size reduced to 55 nm with a remarkably low PDI of 0.06.  

This data demonstrates the predicable scalability which is favourable especially for GMP manufacturing and regulators which means you can start to introduce process controls that are automated – process analytical technologies (PAT). Automated analysis of properties such as online particle size enables the option to automatically control any deviations in size and feed that back to control the pumps and optimise control and give the correct size again. This increases confidence in quality of production meaning throughput can be increased further. ATA Scientific offers several technologies to characterise LNPs.

Contact us for a demo today!

A Fundamental History of RNA

Whilst the planet soon learnt these few letters, mRNA, thanks to COVID and the lifesaving vaccine approach it afforded; RNA arguably is a molecular fossil – a piece of evolution that likely existed before modern cells. 

The RNA world hypothesis suggests that life on Earth began with a simple RNA molecule that could copy itself without help from other molecules. How could we hypothesise this? Think about hereditary expression and how that is conferred. If this was indeed the case, then RNA would have to both store genetic information and catalyse the reactions for the cells. Curiously RNA persists in catalysing many of the fundamental processes in cells today. How DNA rose to be the genetic material and how did the code arise, when did proteins become the main catalyst? If we have such a little handle on the history, then the body of present knowledge is clearly lacking depth, a world of wonder is yet to be discovered. Insight can be found in “The RNA World and the Origins of Life”1

Understanding RNA

All living cells contain RNA (Ribonucleic Acid) in its many forms, whilst there are structural similarities to DNA there are clear differences. Most RNA is single stranded, has a backbone with alternating phosphate groups and a sugar called ribose. Each of these sugars has attached one of four bases, adenine (A), uracil (U), cytosine (C) or guanine (G). There are many forms of RNA such as: messenger RNA (mRNA), Transfer RNA (tRNA), ribosomal RNA (rRNA), Small Interfering RNA (siRNA), small RNA (sRNA) and the list seems to be expanding. RNA is ubiquitous. It is involved in gene expression and some viruses use it for their genomic material. RNA is a fundamental building block of life. 

We are familiar with the use of mRNA for its usefulness in our immune responses to pathogens – such as COVID – 19. It’s success is largely due to a culmination of an enormous body of knowledge. Hundreds of scientists had worked on mRNA vaccines for decades before the coronavirus pandemic brought a breakthrough. Many Australian scientists including those at the Australian National University (ANU) made important contributions towards understanding the role of RNA. In the 1970s the Shine-Dalgarno sequence was discovered which tells the bacteria where to start protein synthesis so that the genetic code in mRNA is read correctly. This insight has enabled scientists to use bacteria as biofactories to make a host of different proteins that are now in use as drugs such as antibiotics, vaccines and cancer therapies or form part of important processes in biotechnology to develop yeasts, pesticides, enzymes, fuels, and solvents.

Traditionally, vaccines can take around 10 years to develop and consist of entire pathogens that have been killed or weakened so that they cannot cause disease. The recent COVID mRNA vaccines were developed in under a year and work by defining the genetic code of the target – easy now but before 1990 and the start of the Human Genome Project, this would have been particularly arduous. mRNA delivers the instructions your body needs to recognise the virus and fight it off. Cells then break down the mRNA and get rid of it. This gives cells the opportunity to change the type and number of proteins made based on demand which is key to allowing living things to grow, change, and react to their environment.

RNA is generally synthesised from DNA (often bacterial) by the enzyme RNA Polymerase through a method called transcription (think trans-scribe – i.e., to write) where not a copy but the complimentary RNA sequence to the DNA template is produced. The protein production is handled by the ribosome, these proteins are released, and the body sees them as foreign and mounts an antibody response, voila – a vaccine. No need to grow batches of cells in bioreactors or infect millions of eggs. The RNAs involved in this procedure are mRNA, tRNA and rRNA. In a self-amplified mRNA (samRNA) consider not only are we attempting to defeat a virus, but we also hijack another part of a virus’ genetic machinery to aid in it. The alpha virus is manipulated by replacing viral structural proteins with the gene of interest. The genes encoding the Alphavirus RNA replication machinery are retained which translates into an RNA Dependent RNA Polymerase that is responsible for creating many copies of the sub-genomic RNA, resulting in the translation of multiple antigens, thus reducing the initial dose requirements. 

Plunge yourself back into the dark days of 2020, close your eyes and transport yourself to New York, picture the refrigerated trucks lined up with scores of dead as the morgues had overflowed, the palpable fear of everyone as they potentially could be carrying your death sentence. Then, as Sandra Lindsay (Director of nursing critical care at Long Island Jewish Medical Center) explained “My whole life just changed tremendously in that one moment in time,” she added “What was going through my mind is, I cannot wait for this needle to pierce my arm,” 2. Sandra was the first person in the U.S. to get a Covid vaccine outside a clinical trial. Interestingly Covid vaccines prevented more than 3.2 million deaths and 18.5 million hospitalisations in the U.S. from December 2020 through November 20222. In this context the mRNA vaccines were tremendous, they were developed and created in record time, it is likely the simplest, safest vaccine that has ever been produced. Such speed can only be appreciated in context, Moderna’s COVID vaccine development was initiated after the SARS-CoV-2 genome was posted on January 10, 2020; manufacture and delivery of clinical trials material was completed within 45 days, and the first trial participants were vaccinated on March 16, 2020, just 66 days after the genomic sequence of the virus was posted. Arguably a ‘vaccine’ material would have likely been produced in about a week – in contrast to a cell based or cultured vaccine would take months to produce, then the scale up to pandemic levels is another massive undertaking.  

Bivalent vaccines that protect against 2 strains are commonplace now and have proven to show greater effectiveness. It was earlier postulated the possibility to load an array of vaccines into one shot – ponder having an annual shot for Covid, Flu and whatever else is lurking out there to mess with our day. RNA certainly lends itself to this, though vaccines are just one modality of use for RNA. 

Things become less clear when defining the role of long non-coding RNAs (lncRNAs). Largely thought of as ‘Junk’ RNA in the past, the last decade has seen evidence mount for the lncRNAs3 having key roles in gene regulation and studies are noting a divergence of biogenesis of lncRNA compared to mRNA. Localisation of the lncRNA and their interactions with proteins, DNA and RNA appears to give insight into their roles be it interfering with signalling pathways, chromatin modulation, affecting stability and translation of mRNA in the cytoplasm along with the regulation and function of membraneless nuclear bodies. Such processes have a knock-on effect in gene expression impacting a varied array of physiopathological and biological conditions including cancer, immune responses, and neuronal disorders. Their localisation and condition specific patterns are gaining interest as biomarkers for disease states. So much for Junk!

RNA Therapeutics

Before we dive into what therapeutics are possible with RNA, perhaps it is best to understand how this can be achieved. Consider the process of DNA forming RNA then forming proteins – there are 3 distinct ways to use this process to prevent disease. I) Gene knockout – completely remove the DNA, 2) prevent or alter the Transcription of RNA from DNA, 3) prevent or alter the Translation of the protein. 

Transcriptional Silencing is not as simple as once assumed. The most highly studied phenomenon in epigenetic modifications by far is DNA methylation, which typically refers to covalently attaching a methyl group (CH3) to the 5th position of the cytosine nucleotide by means of a group of specific enzymes called DNA methyltransferases (DNMTs) using S-adenosyl-L-methionine (SAM) as substrate4.
Resolving genetic defects at this point can have a “global” or complete rectification of the disorder, importantly other processes may be at play permitting alternative modes of action such as the terrific ‘R-loop’ research in Fragile X syndrome5.

One of the most important advances in biology has been the discovery that siRNA (small interfering RNA) is able to regulate the expression of genes, by a phenomenon known as RNAi (RNA interference). siRNA is a double stranded non-coding RNA typically 20 – 27 base pairs in length. It has some specific properties where the primary and secondary modes of action are the inhibition of translation and mRNA cleavage.

The major difference between siRNAs and microRNA/ miRNAs is that the former are highly specific with only one mRNA target, whereas the latter have multiple targets. microRNA controls gene expression mainly by binding with mRNA in the cell cytoplasm. Instead of being translated quickly into a protein, the marked mRNA will be destroyed and recycled, or it will be preserved and translated later. If miRNA is under expressed the level of the protein it normally regulates may be high, and visa versa6.  

miRNA is often used in cancer diagnosis, cancer prognosis and drug discovery research given its use in determining the function of a protein or gene in a cell. The miRNA-based therapeutics could be categorised into two types: miRNAs mimics and miRNAs inhibitors. The former are double-stranded RNA molecules that mimic miRNAs, while the latter are single-stranded RNA oligos designed to interfere with miRNAs. For example, there are clinical trials into miRNA mimics to treat blood cancers, fibrosis, and a tumour suppressor miRNA for solid tumours just to show the breadth of application. For more about RNA therapeutics see Fig 1. from: RNA-based therapeutics: an overview and prospectus8

The term “undruggable” may be one day a distant relic in an era of genetic medicines. The growing understanding of RNA functions and their crucial roles in disease lends weight to broadening the therapeutic targets. Research is scratching the surface of what is possible and if the body of research into non-coding RNA is any indicator, this scratch will likely resolve any itch. Slack and Chinnaiyan’s review in Cell7 removes all doubt. RNA, due to its distinct physiological and physiochemical properties can theoretically target any gene of interest should the correct nucleotide sequence be selected. The enormity of the genome thus holds great prospect for such therapeutics, diagnostics, and silencers. Pitch this against the only 0.05% of the genome drugged by current approved protein targeted small molecule chemicals and antibodies. Besides, around 85% of proteins lack specific clefts and pockets for small molecules binding8.  

The infancy of this technology and the runs on the board are encouraging. Fomivirsen is the first FDA-approved ASO ( antisense oligonucleotide) drug for treating cytomegalovirus retinitis (CMV) in patients with AIDS, Patisiran is the first FDA-approved RNAi-based drug for treating Familial amyloid polyneuropathy, also called transthyretin-related hereditary amyloidosis. Sarepta Therapeutics ‘Eteplirsen’ for Duchenne Muscular Dystrophy (DMD) has completed clinical trials. Notably the ASO for spinal muscular atrophy, Nusinersen targets the CNS (central nervous system) was approved in 2016, this previously undruggable disease has new hope. It is referred to as an orphan drug given the rare genetic nature of the disease. Showing promise was the Translate Bio MRT5005 inhalable mRNA treatment for Cystic Fibrosis.  Unfortunately, there was no pattern of increases in ppFEV1 (percent predicted forced expiratory volume in 1 second) – a measure of lung function. Despite this, a great deal can be gleaned from this trial, notably the tolerability of multiple mRNA doses, the appeared absorption into the blood from an initial inhalation of the mRNA, plus evaluation of immunogenicity markers showed no clear pattern of anti-CFTR antibodies, anti-PEG antibodies or T-cell sensitisation to CFTR.

The mRNA was delivered in a LNP (Lipid NanoParticle) and promisingly there were no patients which had detectable levels of lipid in the blood10.  Sanofi acquired Translate Bio in Aug 2021 post the announcement of the clinical trial results. Today, there are already 18 clinically approved RNA-based therapeutics, including two vaccines that made mRNA a household word during the COVID-19 pandemic11

Initially RNA -based therapeutics were embraced with clear rationales for disease in oncology, neurology, and infections. Given the advancement in research there are around 8 ASOs, 3 siRNAs and two mRNA FDA approved drugs. Ito et al9 conducted a review of Clinical trials with ncRNAs showing a staggering 757,348 published articles with a PubMed search with 321,672 since January 2017. I mention this to articulate the depth of research. Of the 108 their exclusion criteria failed to remove, there is a clear trend, 95% were ncRNAs used as observational tools and clearly only a few interventional in clinical trial. I expect the number of interventional ncRNA therapeutics in Clinical trial to explode in the near future fuelled largely by small biotechs and academia spin outs. 

RNA Diagnostics

The development of the Nobel Prize winning discovery of the Polymerase Chain Reaction (PCR) technique is an exemplar of how previous discoveries pave the path for something special. By 1980 all the components required to perform PCR amplification were known, it was only a matter of time before Kary Mullis put these pieces together to create the thermo-cycled PCR amplification we know today.
Reverse Transcription Polymerase Chain reaction (RT-PCR), Quantitative real-time Polymerase chain reaction (qPCR), Reverse Transcription quantitative real-time polymerase Chain reaction (RT-qPCR), and RNA sequencing (RNA-seq) today form the basis of RNA diagnostics. Whilst the application for RNA previously described here focusses on the production of a protein or a mechanism for gene manipulation, it is clear that RNA is dynamic with diverse and essential roles throughout the entire genome. The broad distribution and utility of the biomolecule has made it a foci for diagnostic, prognostic, and biomarker functions, however, the translation to clinical diagnostics has unearthed significant challenges, particularly in the realm of liquid biopsies. 

Historically, the detection of specific mutations in cell free DNA (cfDNA) has been the main thrust of research with a few cfDNA tests being approved by the FDA for diagnosis and since 2020 only one is based on next generation sequencing. There currently are no cell free RNA (cfRNA) clinical diagnostic tests approved.

What is promising is the pot of gold that awaits the inventor of the technology to become the gold standard for diagnostics, the liquid biopsy market is expected to eclipse 5.8 billion dollars by 202612. Not withstanding the lack of standardisation of method to collect, prepare, screen and analyse a sample plus the contamination issues of cellular RNA and DNA the technology issue may be dwarfed by the enormity of the project. Firstly, consider the conundrum. There is a need to screen a population of otherwise asymptomatic individuals to gather the data required given the concept of cfRNA targeting is early detection – before a tumour is developed and there is cfDNA floating about. Historical retention samples are of little use currently as the modality of preservation has been shown to contaminate the results. Without standardised methods that respect the inherent biases and sufficient cohorts to assess, it is likely the requirements are beyond the grasp of even the most collaborative research projects. The data interpretation will be challenging and arduous for medical staff inadept in bioinformatics and statistical analysis. miRNA may be surpassed by long RNAs given some recent promising results in new disease-associated RNAs, albeit very early stages these may be the next revolution in screening and diagnosis. 

CRISPR:

Better known as genetic scissors to the layperson, the discovery13 of this remarkable tool is a triumph for collaborative research, conference meetings, and a quest of deciphering the unknown. Bacteria have a mechanism for not only fighting off viruses but a memory method for future infections not only in the individual bacterium, but this memory is passed down through generations. This is an adaptive immune system that detects viral DNA and destroys it – to achieve this they use CRISPR (Clustered Regularly Interspaced Short Palindromic Repeats). What is interesting is it is programmable, in the original study Doudna and Charpentier13 decided to use some purified Cas9 protein and combined them with a crRNA (Crispr RNA) strand to see if they could duplicate the phenomenon by finding a unique DNA sequence and cut it – this failed. Given the abundance of another RNA in bacteria and the vicinity of it to the CRISPR protein the collaborators postulated it may be needed. They included tracrRNA and this cleaved the DNA. Next step was to purify the tracrRNA and fuse it with the CRISPR, create an experiment where different genetic codes are programmed in to cut at specific lengths of DNA, this was hugely successful, earning a Nobel Prize.
An explosion of research to utilise this ensued, and the lay-media went for the unintended use of genetically engineering babies to be smarter, faster, stronger totally misinterpreting the intent of the research and it’s potential to be used to treat genetic diseases. 

Putting the ethics aside, the use of RNA in this is pivotal. Using a guide RNA, CRISPR has transformed the world of genomics, now it is possible to target a disease such as Duchenne Muscular Dystrophy in the aim of resolving the genetic defect. CRISPR Cas9 can be used to disrupt a sequence- inactivating a gene, larger sections of DNA can be cleaved either side of the desired deletion followed by a cellular repair process that joins the strands thus deleting the gene. 

Another action is to correct the gene by homology directed repair, the DNA is cleaved as in deletions but the cell uses the supplied DNA template to repair the break, thereby replacing the faulty DNA sequence or even inserting a new gene14.
‘In short, it’s only slightly hyperbolic to say that if scientists can dream of a genetic manipulation, CRISPR can now make it happen. At one point during the human gene-editing summit, Charpentier described its capabilities as “mind-blowing.” It’s the simple truth. For better or worse, we all now live in CRISPR’s world´15

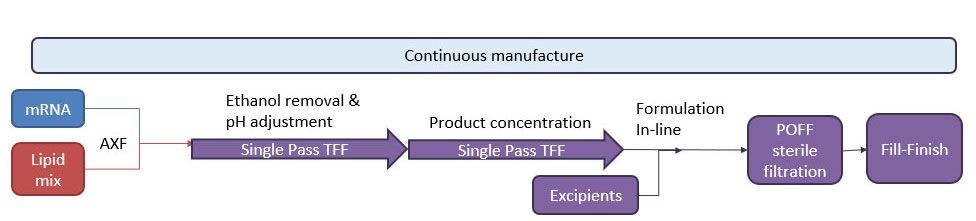
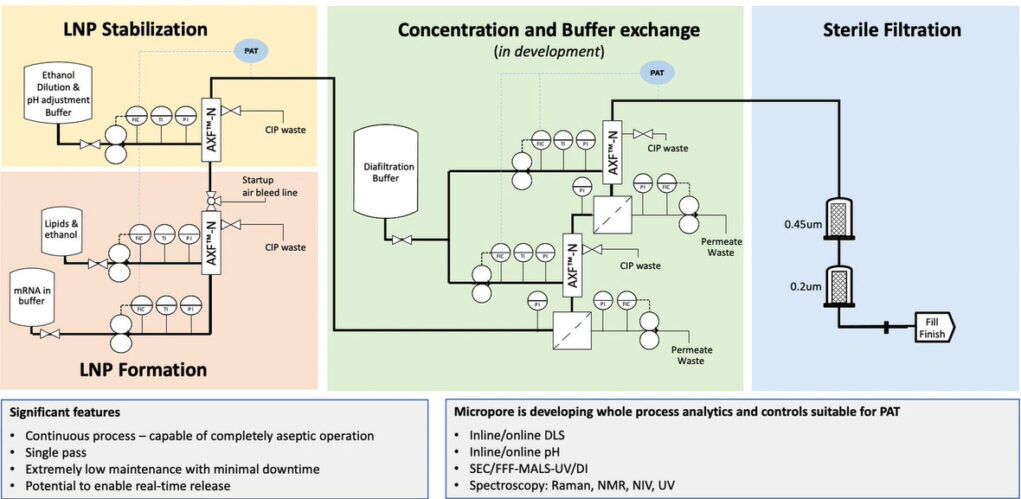
Evolution of Nanomedicine Production Technology 

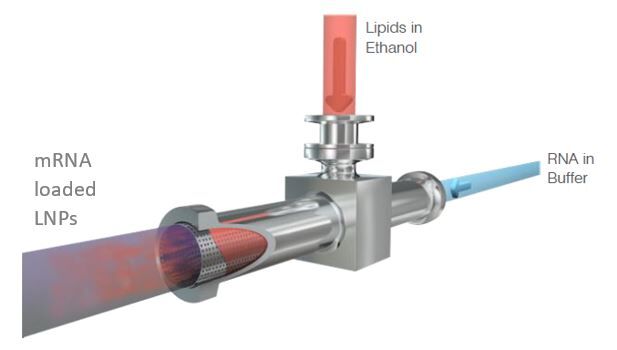
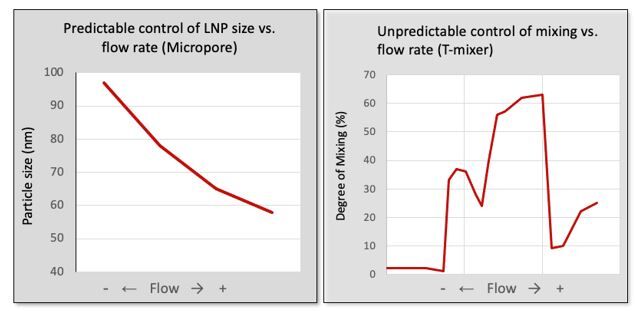
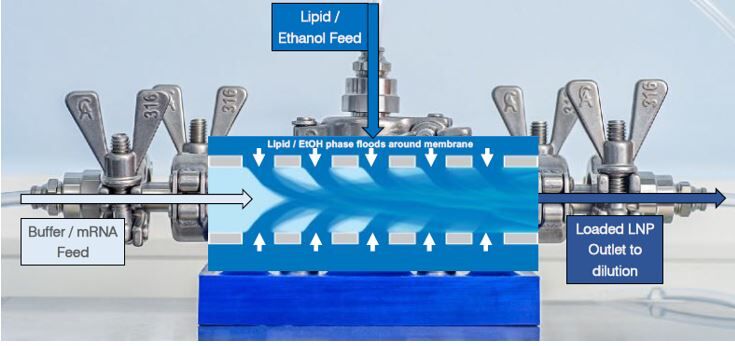
As RNA science continues to make headlines around the world as the new way of making safer, more targeted medicines, it has sparked a wave of new studies. With this comes the need for improved methods that deliver faster, more efficient and scalable drug manufacturing. Currently mRNA-LNP drugs are produced using methods such as lipid hydration, extrusion or impingement jet mixing (IJM), but these suffer from turbulent mixing and multiple harsh processing steps which compromise stability and give high batch variability. Microfluidic mixing offers rapid formulation with low polydispersity but again cannot accommodate high-volume production.

Micropore Pathfinder offers seamless scalability from initial R&D (0.2 mL) to final pandemic-scale GMP manufacturing (1500 L/h). This translates to 58,000 doses of vaccine every minute from a device small enough to fit in the palm of the hand. Collaborations with The University of Strathclyde and Professor Yvonne Perrie demonstrated mRNA encapsulation efficiencies over 97% in LNP production using Micropores AXF advanced crossflow mixing. This demonstrates that the Micropore Pathfinder can provide efficient mass production of a new generation of RNA-based therapeutics. The series is designed to be easy to operate, highly reproducible and stable in operation.

Book a demonstration with us today and try it yourself !

References.

  1. ‘The RNA World and the Origins of Life’ Bruce Alberts 2002; https://www.ncbi.nlm.nih.gov/books/NBK26876/ site access 15May2023
  2. ‘Two years after Covid vaccines rolled out, researchers are calling for newer, better options’ Aria Bendix, NBC News 14 Dec 2022. https://www.nbcnews.com/health/health-news/two-years-covid-vaccines-rcna57902 Site accessed 23 May 2023.
  3. ‘Gene regulation by long non-coding RNAs and its biological functions’ Luisa Statello et al 2020; https://www.nature.com/articles/s41580-020-00315-9 site accessed 17 May 2023
  4. ‘DNA Methylation Signature of Aging: Potential Impact on the Pathogenesis of Parkinson’s Disease’ Yazar V, Dawson VL, Dawson TM, Kang SU. 2023, https://www.ncbi.nlm.nih.gov/pmc/articles/PMC10041453/  site accessed 22 May 2023
  5. ‘Site-specific R-loops induce CGG repeat contraction and fragile X gene reactivation’ Hun-Goo Lee et al Cell, 2023. https://www.sciencedirect.com/science/article/abs/pii/S0092867423004695?dgcid=author Site accessed 23 May 2023.
  6. ‘The Limitless Future of RNA Therapeutics’ Damase et al ; 2021 https://www.frontiersin.org/articles/10.3389/fbioe.2021.628137/full Site accessed 24 May 2023
  7. ‘The Role of Non-coding RNAs in Oncology’ Frank J. Slack and Arul M. Chinnaiyan, Cell 2019. https://doi.org/10.1016/j.cell.2019.10.017 site accessed 25 May 2023
  8. ‘RNA-based therapeutics: an overview and prospectus’ Zhu et al; Cell death and Disease 2022. https://www.nature.com/articles/s41419-022-05075-2 Site accessed 25 May 2023
  9. “Current clinical trials with non-coding RNA-based therapeutics in malignant diseases: A systematic review’ Ito et al, Translational Oncology 2023. https://doi.org/10.1016/j.tranon.2023.101634 site accessed 25 May 2023
  10. Translate Bio Announces Results from Second Interim Data Analysis from Ongoing Phase 1/2 Clinical Trial of MRT5005 in Patients with Cystic Fibrosis (CF)’ Translate Bio, Inc. bit.ly/3BVUJC2 site accessed 25 May 2023
  11. ‘RNA therapeutics’ Michelle L. Hastings & Adrian R. Krainer; RNA (2023) Vol. 29, No. 4
  12. ‘Current challenges and best practices for cell-free long RNA biomarker discovery’ Cabús, L., Lagarde, J., Curado, J. et al. Biomark Res 10, 62 (2022) https://doi.org/10.1186/s40364-022-00409-w site accessed 30 May 2023.
  13. Discovery Story: Genome Engineering with CRISPR-Cas9 (Doudna, Jinek, Charpentier)   https://youtu.be/jm5QqxN7Hkw  iBiology.org May 2017 site visited 31 May 2023
  14. CRISPR/Cas9 – a specific, efficient and versatile gene-editing technology we can harness to modify, delete or correct precise regions of our DNA https://crisprtx.com/gene-editing/crispr-cas9 CRISPR Therapeutics 2023. Site accessed 31 May 2023.

And Science’s 2015 Breakthrough of the Year is… https://www.science.org/content/article/and-science-s-2015-breakthrough-year  John Travis 2015. Site accessed 31 May 2023.

Brownian Motion

What is Brownian Motion and Why Is It Important?

In 1827, Scottish botanist Robert Brown looked through a microscope at pollen grains suspended in water, and discovered the pollen was moving in a random fashion – tiny particles did not slow or stop, but were in constant motion. This phenomenon, we now call Brownian Motion, is not unique to pollen but is commonly observable in daily life. It is not specific to biology either but instead has been proven mathematically and is due to physics. Most people might have noticed dust particles dancing in a ray of light in a dark room or the diffusion of pollutants/smoke in the air or diffusion of calcium in bones – these are all examples of Brownian motion. 

Brownian motion is the random movement of particles due to the bombardment by the molecules that surround them. Understanding Brownian motion is important because it provides us with the evidence that atoms exist. Einstein’s mathematical model of Brownian motion from 1905 is one of his least well known but very important contributions to physics. It described how tiny visible particles suspended in a liquid are bombarded or moved by invisible water molecules around them causing them to jiggle. The model explained this motion in detail and was able to accurately predict the irregular random motions of the particles which could be directly observed under a microscope. Einstein’s theory of Brownian motion offered a way to prove that molecules exist despite the fact that molecules are too small to be seen directly. Soon after a French physicist J.B. Perrin conducted a series of experiments that confirmed Einstein’s predictions. The theory also helped to understand how particle size is related to their speed of movement. 

What causes Brownian motion?

While Brownian motion of small particles has been observed quite easily using a light microscope and studied for the past 200 years, the mechanism that drives Brownian motion is not well understood. What we do know is that Brownian motion is caused both by the structure and physics of fluids, i.e., liquids and gases. According to kinetic theory as proposed by J.C. Maxwell, L. Boltzmann and R.J.E. Clausius, all matter is in motion; atoms and molecules especially within liquids and gases are in constant vibrating motion. These particles will travel in straight lines until redirected by a collision. Particles within gases and liquids are constantly moving, colliding, and moving toward equilibrium.  

There are mainly 4 factors that affect Brownian motion: temperature, particle number, particle size, and viscosity. The larger the particle or molecule and the more viscous the dispersion medium, the slower the Brownian motion will be. Smaller particles are “kicked” further by the solvent molecules and move more rapidly. In addition, a high temperature and a high number of particles, all increase the rate of motion.

How do you measure Brownian motion?

Given particle speed of movement or Brownian motion can be correlated to particle size, various analytical measurement techniques have been developed that exploit this relationship. 

Dynamic Light Scattering (DLS) – Malvern Zetasizer

Dynamic light scattering measures Brownian motion and relates this to the size of the particles. DLS, sometimes referred to as Photon Correlation Spectroscopy or Quasi Elastic Light Scattering (QELS), is a non-invasive, well-established technique for measuring the size and size distribution of molecules and particles dispersed in a liquid typically in the submicron region and extending to lower than 1nm using the latest technology pioneered by the manufacturer MalvernPanalytical. Typical applications of dynamic light scattering are the characterisation of particles, emulsions or molecules which have been dispersed or dissolved in a liquid. Common samples analysed by DLS include colloidal silica, titanium dioxide, ceramics, carbon dots, lipid nanoparticles, proteins and adeno-associated virus (AAV). The sensitivity of modern systems is such that it can also be used to measure the size and concentration of macromolecules in solution with little dilution using small sample volumes (3µL). 

The Malvern Zetasizer which utilises sophisticated DLS technology works by determining the rate at which the intensity of the scattered light fluctuates when detected using an optical arrangement. Briefly, a cuvette containing particles in suspension (moving under Brownian motion) is illuminated by a laser causing the light to be scattered at different intensities. The small particles cause the intensity to fluctuate more rapidly than the large ones. Analysis of the intensity fluctuations yields the velocity of the Brownian motion and hence the particle size which is measured as the hydrodynamic diameter. 

The speed of movement of particles or velocity of the Brownian motion is defined by a property known as the translational diffusion coefficient. The size of the particle or the diameter that is obtained by DLS indicates how a particle diffuses within a fluid and is essentially related to the diameter of a sphere that has the same translational diffusion coefficient as the particle.

The size of a particle is calculated from the translational diffusion coefficient by using the Stokes-Einstein equation;

d(H)= kT/3πηD

where:-

d(H) = hydrodynamic diameter

D = translational diffusion coefficient

k = Boltzmann’s constant

T = absolute temperature

η = viscosity

Factors that can affect the velocity of Brownian motion

A number of factors can affect the accuracy and precision of DLS measurements, including temperature stability and accuracy. An accurately known temperature is necessary for DLS because knowledge of the viscosity is required (because the viscosity of a liquid is related to its temperature). The temperature also needs to be stable, otherwise convection currents in the sample will cause non-random movements that will impact the correct interpretation of size.

The measurement of the particle translational diffusion coefficient will depend not only on the size of the particle “core”, but also on any surface structure that will affect the diffusion speed, as well as the concentration and type of ions in the medium. The ions in the medium and the total ionic concentration can affect the particle diffusion speed by changing the thickness of the electric double layer which is called the Debye length. A low conductivity medium will produce an extended double layer of ions around the particle, reducing the diffusion speed and resulting in a larger, apparent hydrodynamic diameter. Conversely, higher conductivity media will suppress the electrical double layer reducing the measured hydrodynamic diameter. Any change to the surface of a particle that affects the diffusion speed will correspondingly change the apparent size of the particle. Similarly, an adsorbed polymer layer projecting out into the medium will reduce the diffusion speed more than if the polymer is lying flat on the surface. The nature of the surface and the polymer, as well as the ionic concentration of the medium can affect the polymer conformation, which in turn can change the apparent size by several nanometers.

DLS will not be applicable when the particle motion is not random. Therefore the maximum particle size that can be measured reliably by DLS is sample dependent and is normally defined by the onset of particle sedimentation. All particles will sediment and the rate will depend upon the particle size and relative densities of the particles and suspending medium. For successful DLS measurements, the rate of sedimentation should be much slower than the rate of diffusion since a consequence of slow diffusion is long measurement times. The presence of sedimentation can be determined using the Malvern Zetasizer by checking the stability of the count rate from repeat measurements of the same sample. Count rates which are decreasing with successive measurements indicates that sedimentation is present and the Expert Advice system will highlight this to the user.

Nanoparticle Tracking Analysis (NTA) – New Malvern NanoSight Pro

The advent of advanced computer technology with video analysis has allowed scientists to make automated measurements with visual validation to understand the dynamics of the motion and more accurately quantify the particles in a suspension. 

Nanoparticle tracking analysis (NTA) utilises the properties of both light scattering and Brownian motion to obtain the particle size distribution of samples in liquid suspension.  Simply, a laser beam is passed through the sample chamber, and the particles in suspension in the path of this beam scatter light in such a manner that they can easily be visualised via a microscope onto which is mounted a camera. The camera captures video files of the particles moving under Brownian motion within the field of view. Intuitive software simultaneously identifies and tracks the center of each of the observed particles, and determines the average speed moved by each particle. This value allows the particle diffusion coefficient to be determined from which, if the sample temperature and solvent viscosity are known, the sphere-equivalent hydrodynamic diameter of the particles can be identified using the Stokes-Einstein equation. 

Both NanoSight NTA and Zetasizer DLS measure the diffusion coefficient and derive the size from that diffusion coefficient. DLS provides excellent population statistics for an average size (by intensity) and average size distribution or polydispersity index. NTA on the other hand provides single particle tracking for a highly peak-resolved distribution by number combined with concentration determination and a fluorescence mode allows differentiation of suitably labelled particles. For biomedical research, using a fluorescently tagged drug molecule makes it possible to determine how many drug delivery nanoparticles had successfully been loaded with drug molecules. Integrating a combination of both DLS and NTA systems can help take advantage of the complementary information the two techniques can provide.

The new NanoSight Pro nanoparticle tracking analysis (NTA) system from Malvern Panalytical integrates advanced engineering with machine learning to provide the most detailed NTA solution for the characterization of bio- and nanomaterials.  Smart tools built into the software automate workflows and help remove subjectivity to generate extremely accurate and reproducible size and concentration data. An upgraded temperature controller allows stress and aggregation studies to be performed at up to 70°C. Advances in fluorescence measurement provide powerful insights into sample specificity while opening new possibilities in diagnostic, biomarker analysis and therapy applications. Previous limitations linked to small biological particles and other low scatterers are overcome by NanoSight Pro, which is optimised for use with samples including exosomes, viruses, vaccines, and drug delivery systems.

Ensure High Quality in Analytical Characterisation with ATA Scientific

NanoSight is already trusted by scientists around the world for its superior data quality and ease of use, with thousands of publications referring to NanoSight NTA data. As the world continues on it’s journey into developing better products to improve our daily lives especially related to research focused on drug delivery, viruses and vaccines, high-quality analytical characterisation is now even more important. Contact us for a free demonstration to discover how we can help you achieve more. 

A Simple Guide For Preparing Samples For Sem Imaging

Scanning electron microscopes (SEMs) are versatile instruments and they can do much more than you would expect. An SEM can provide key information such as structure, morphology and elemental composition about the surface or near-surface region of a sample. For this reason, it has become the tool of choice for several fields from material science to forensics, battery and additive manufacturing and more.  Desktop SEMs have now been personalised enabling faster, easier to use, on-site SEM imaging and analysis.   

Good sample preparation is a critical step when a high-quality SEM image is needed. Some samples can be quite challenging to image particularly if they are non-conducting. This guide will provide users with a few helpful tips and tricks when preparing samples for imaging. Meant for those who are approaching scanning electron microscopy for the first time, or are relatively new to it, this guide will ensure you obtain good results and get the highest detailed information from your samples. The content is valid for small to larger sample sizes of various compositions. For more detailed information on specific kinds of samples, please contact us.

Basic sample preparation

Every SEM is equipped with a sample holder or a loading chamber where the sample can be inserted.

To load a sample in a SEM, the use of aluminium stubs is recommended. These come in different, standard sizes and are readily available on a commercial basis.

Sample adhesion to the surface of the stub is crucial before placing it in the sample holder or stage. This will prevent pieces of sample being dislodged under vacuum and contaminating the SEM column which can affect the final image quality. It may also damage the SEM imaging system which can be expensive to repair.

TIP 1: Stick the sample securely to the pin stub, by using:

  • Double-sided carbon sticker
  • Conductive paint
  • Conductive tape
  • Special clamps
  • A combination of the above.

TIP 2 : Remove all loose particles from your sample after adhering the sample to the pin stub by:

  • Holding the aluminium stub with tweezers, tilt it by 90° and gently tapping it on its side.
  • Spraying dry air on the sample.

TIP 3: Use tweezers when handing the pin stub

  • This should be done in order to prevent contamination.

TIP 4: Make sure that the mounting procedure is solid

  • This is so that you do not introduce mechanical vibrations due to incorrect mounting.

TIP 5: DO NOT spray dry air in the direction of any electronics 

  • Or a scanning electron microscope, because it might be flammable.

TIP 6: Make sure there is no condensed liquid in your spray air straw 

  • You can do this by first spraying away from your sample.

These precautions will help to reduce the risk of contamination of your system and sample holder and guarantee better performance over time. Below we discuss best practice sample preparation techniques for 5 common sample types which include: Non-conductive samples; Magnetic samples; Beam sensitive samples; Powders and particles and Samples containing moist or outgassing samples.

Non-Conductive samples

When a non-conductive material like a biological sample is imaged, the electrons fired onto the sample surface don’t have a path to the ground potential, causing them to accumulate on the surface. The image will become increasingly bright or entirely white until details are no longer visible. Mild movement can also be detected, caused by the mutual interaction of the electrons. This will cause blurriness in the collected image. 

Several solutions are widely used:

  • Conductive tapes or paints

By covering part of the sample with a piece of conductive tape (e.g. copper tape) or some conductive paint, a bridge to the surface of the aluminum stub is created. SEM image of sugar cube charging. SEM image of sugar cane in low vacuum. This will allow the sample to partially discharge and is enough to image mildly non-conductive samples when imaging areas close to the tape edge.

  • Low vacuum

Introducing an atmosphere in the sample chamber allows beam interaction with air molecules. Positive ions are generated and attracted by the large number of electrons on the sample

surface. The ions will further interact with the electrons, discharging the sample. While this technique adds some noise to the final image, you can analyse the sample faster and at lower cost without further processing.

Designed to eliminate additional sample preparation of non-conductive samples, it allows samples such as paper, polymers, organic materials, ceramics, glass, and coatings to be imaged in their original state. The charge reduction sample holder contains a pressure limiting aperture which allows a controlled amount of air into the sample chamber to raise the pressure around the sample. The leakage rate is designed for optimal charge reduction while maintaining a high vacuum in the column for stable system operation. Compared to standard holders, the charge reduction sample holder can be used to obtain significantly higher magnification images from non-conductive materials. 

  • Sputter coating

By using a sputter coater such as the LUXOR series, it is possible to create a thin layer of a conductive material on the sample surface. This creates a connection between the surface of the aluminum pin and the ground potential. The choice of coating material is strongly dependent on the kind of analysis to be performed on the sample. Gold and platinum are ideal materials for high-resolution images because both have extremely high conductivity. Lighter elements, like carbon, can be used when Energy Dispersive Spectroscopy (EDS) analysis on non-organic samples is required. An alloy of indium oxide and titanium oxide (ITO) can create transparent, conductive layers, to be used on optical glasses to make them suitable for SEM.

However, there are disadvantages to using a sputter coater: Additional instrumentation is required, the analysis becomes more time consuming, and the samples undergo more pumping cycles. Also, any advantage of using a backscatter electron detector (BSD) to image the sample is lost, as the contrast becomes very homogeneous and there is no difference in gray intensity for different elements. The option for EDS analysis for elemental analysis is also lost.

Magnetic samples

Samples that generate a magnetic field can interfere with the accuracy of the electron beam, reshaping it and producing deformed, blurry images, usually elongated along one axis.

This problem is known as stigmation alteration and consists of an increase in the eccentricity (a measure of how circular the curve is) of the beam cross section. Bigger eccentricities are less curved.

Stigmation correction 

All SEMs offer the chance to tune the stigmation. Certain instruments require the user to fix stigmation values every time, while others can store standard values that are valid for most samples.

The procedure alters the magnetic field of the lenses, which reshapes the beam. When the shape is circular again, the best image can be produced. When changing the stigmation, it might be necessary to finetune the focus again.

Beam-sensitive samples

Delicate samples, like thin polymeric foils or biological samples, can be damaged by the electron beam due to the heat generated in the interaction area or the rupture of chemical bonds.

This will result in either a hole in the surface or a progressive deformation of the scanned area.

Beam settings

The easiest way to reduce this effect is to use lower values for voltage and current. In these cases, the smallest possible values are recommended.

Sputter coating

In the worst cases, a thin coating layer can be applied to the sample to shield the sensitive surface. Increased conduction will also improve image resolution.

Cooling

Thermal effects can be reduced by using a temperature controlled device. Removing the heat generated by the beam will protect the sample from thermal-induced surface modifications.

Time

Spending a long time on a specific spot will cause damage to the sample, over time. Being quick during the analysis will prevent excessive alterations, but might not produce the best results in terms of image quality.

Magnification

Zooming in implies having the same number of electrons shot on a smaller area. The thermal drift is increased and the deformation effects will become more evident. When possible, low magnification is recommended.

Powders and particles


When imaging particles, information like particle size or shape are important in the design of the process flow. The easiest way to prepare a powder or particles sample is to collect a small amount of sample with a spoon and let it fall on a carbon double-sided sticker, then using spray air to remove the excess particles.

Unfortunately, this method will cause many particles to overlap, hiding important features, or to be blown off, inducing errors in particle counting routines.

Particles disperser

The best way to prepare a powder sample is by using a particle disperser unit such as our Nebula. This will allow an even distribution of the sample on the sticker, reducing the incidence of overlapping particles and generating a pattern that can be used to study granulometry. Operational parameters, such us the vacuum level and the amount of sample needed, depend largely on the nature of the powder. Factors to consider:

  • Fine powders require a smaller amount of sample.
  • Delicate samples might break due to strong pressure outburst.
  • Hydrophilic samples might need a higher vacuum burst to be separated.

Samples containing moist or outgassing samples

When electron microscopes operate in high vacuum levels, every wet sample that is loaded in the imaging chamber will immediately start to outgas.

Certain samples have microstructures that will resist the phase change, providing excellent results without major concerns.

A typical example is a fresh leaf. A sample without a rigid structure can be imaged if force drying or critical point drying is used to prepare it.

Force drying

To verify whether the sample will resist the vacuum, the use of another instrument, such as a desiccator or a sputter coater, is recommended. Eventual changes in the sample should be immediately noticeable.

Critical point drying

Also known as supercritical drying, this technique forces the liquids in the sample to evaporate, maintaining a low temperature. The evaporation is driven by the pressure level, which is broughtbelow the vapor tension of the liquid in the sample. During this process, the liquids will create fractures in the sample, causing modifications in the structure.

Cooling

This is an alternative to drying techniques that will preserve the structure of the sample completely intact by freezing the sample. If the phase change is quick enough, the liquids in the sample will not form crystals and the structure will be perfectly preserved. It is important to consider that the phase change is not permanent and a prolonged exposure to a high vacuum will increase the evaporation rate.

Low vacuum

If the sample does not have a particularly high moisture content, using a small amount of sample at a reduced vacuum level can be enough to collect images. The overall image quality will be lower, but the sample can be imaged in its original state.

Small amount of sample

Using a small quantity of sample is sometimes enough to contain the effects of vacuum and evaporation. The sample can be collected with a toothpick and a veil of it can be deposited on the stub. This technique is particularly effective with gels and emulsions.

Sample preparation is just the beginning for faster and better analysis. Learn how to improve your process even more by speaking with an SEM expert. Contact us today

Reference: https://www.thermofisher.com/au/en/home/global/forms/industrial/sem-sample-preparation-e-guide.html

3 Factors to Consider for Automated Live-Cell Imaging

Live-cell imaging is important for many applications however limitations of conventional methods have constrained its routine use. Reliable live cell imaging requires an environment that keeps the cells functioning during the experiment while also being able to ensure the experimental method is not perturbing the cells and affecting the interpretation of the results. Here we discuss the growing popularity of automated live-cell imaging systems and highlight some key features to look for when selecting a live cell imaging system.

What is live-cell imaging?

Live-cell imaging is a microscopy-based technique used to examine living cells in real-time. It offers deeper insights into dynamic cellular processes such as migration, confluency and signaling and can reveal findings that might otherwise have been overlooked. Both brightfield and fluorescence-based live-cell imaging modalities support a range of different analysis needs.

How is live-cell imaging used?

Applications of live-cell imaging span basic research through to biopharmaceutical manufacturing. In a research setting, live-cell imaging can be used during cell culture to help define the best time for harvest, determine the senescence status of cells, assess drug treatments for cytotoxicity or detect and monitor phagocytosis. For example, Phagocytosis, is a process by which certain live cells, called phagocytes internalise foreign matter. This defensive reaction against infection is key in the study of immunology and plays an important role in immune responses, tissue homeostasis, and continuous clearance of apoptotic cells. Generally, phagocytotic activity is assayed using flow cytometry. However, this process only provides quantitative data and does not provide the means to monitor phagocytosis in real time. Performing fluorescence-based assays using the CELENA® X High Content Imaging System with pH-sensitive fluorescent particles, like pHrodo™ Green, can be an effective and efficient system for quantifying and monitoring apoptosis activity. For biopharmaceutical manufacturing, live-cell imaging has broad utility for process development and control throughout the production of biologic drugs and vaccines.

Limitations of conventional live-cell imaging methods?

Historically, live-cell imaging has involved manually monitoring cells by culturing them in a CO2 incubator. The culture vessel is removed several times to take images of cells over time using a digital microscope. This approach is labor-intensive and highly prone to human error, largely because it offers no means of finding the same position in the culture vessel. Fluctuating environmental conditions can also cause cellular stresses, which can compromise results. While benchtop imaging systems improve on this method, they are bulky and cumbersome, and often struggle to maintain a stable environment.

3 Factors to consider when choosing an automated live-cell imaging system

Automated live-cell imaging systems like the CELENA® X offer a flexible design that is smaller, faster and easier to use to meet both the demands of the drug discovery industry and the basic research needs of the smaller laboratory.

Multiple imaging modes that are affordable

Live cell imaging systems that offer both brightfield and fluorescence options for either time-lapse or real-time monitoring offer maximum flexibility. Celena X integrates an automated fluorescence microscope with quantitative image analysis software to process large datasets at an affordable cost. Its interface allows a user to run multi-well or multi-spectral experiments with capacity for multi-point imaging with only a few clicks. The microscope provides for a multitude of fluorescence cell imaging possibilities by supporting all objective magnification from 1.25x to 100x, both brightfield and phase contrast illumination, and with LED filter cubes.

Stable scanning performance and compatibility

The system is compatible with a wide range of cell culture vessels such as multi-well plates, dishes, flasks and slides to cover a wide variety of assay types. Depending upon the application, either image-based or laser-based autofocus methods can be used. The CELENA® X can be used for image confluency in McCoy cells seeded in 96-well plates over 48 hours with brightfield image-based autofocusing, demonstrating how the system can be modified and applied as a high throughput method for various cell-based assays. With laser-based autofocusing and multiple filter cubes, this method utilised the CELENA® X to image the dose-dependent effects of anti-cancer drugs throughout the cell cycle in HeLa cells seeded in 96-well plates, demonstrating how the system can be used in a multivariate drug screening process.

User friendly interface and 3D modeling

An analysis of high content images with large datasets can cause problems with most types of analytical software. Each new assay requires the creation of new modules, which can be challenging for lab staff and often involves IT staff. The CELENA® X provides an easy-to-use modular-design analysis software based on a powerful CellProfiler engine. Tens of thousands of images can be analysed automatically to obtain quantitative information with a complex software setting or optimisation.

Three-dimensional (3D) cell models can provide a more accurate representation of real cell environments than 2D cell culture systems but requires a different strategy of imaging and analysis compared to 2D cell culture. Organoids, for example, are organ-specific 3D cell models derived from human stem cells, designed to mimic the functionality and structure of human organs while 3D spheroids can represent a gradient of nutrients and oxygen between cells located in both outer and inner layers which is more relevant to physiological environments. These 3D models are notably useful for studying various types of cancers.

The challenge when imaging organoid and spheroid assays comes from organoids having multiple focal planes making it difficult to acquire in-focused images for multiple organoids. For live/dead cell viability of the single organoid, a different analysis strategy is required since individual cells in an organoid do not exist as a single live/dead status. To address this issue, CELENA X employs MergeFocus software module after acquiring Z-stack images from multi-channel fluorescence.

We invite you to use the Celena X automated live cell imaging system today and compare it for yourself.

Contact us to arrange a free trial.

ATA Scientific Pty Ltd
+61 2 9541 3500
enquiries@atascientific.com.au 
www.atascientific.com.au 

Product page link: – https://www.atascientific.com.au/products/celena-x-high-content-auto-cell-imaging-system/