We are helping to Build Better Batteries during development and manufacturing processes.
The Global Shift Towards Renewable Energy
Increasingly the world is experiencing more frequent and intense extreme weather events which are already impacting every region on Earth. At the COP28 United Nations climate talks in December 2023, governments from nearly 200 countries agreed to the transition away from technologies that use fossil fuels, the primary cause of the climate crisis.
Key Challenges:
Rising extreme weather events
Need for fossil fuel transition
Growing demand for clean energy technologies
While fossil fuel technology is the major contributor to climate change, moving to new and more efficient renewable technologies can help us reduce net emissions and create a more sustainable world.
In power generation, transport, heating, cooking and industrial processes like steel and cement manufacturing, we have new technology needed to replace fossil fuels. In fact, surging market demand for clean energy technologies – wind, solar, and electric cars – is now displacing polluting technologies, such as coal-fired power and combustion engine vehicles, on a global scale. Beyond power generation the need for energy storage is undeniable.
Australian Battery Development Landscape
Current Research Developments
Batteries will play a major role in the world’s decarbonisation journey, and Australia is very well placed for this opportunity given its vast mineral reserves (e.g. lithium, nickel, copper and cobalt) and access to innovative our University’s research and development. Australian researchers at the University of Wollongong have been working with; Edge Functionalised Graphene,’ which they say could unlock cheaper and better-performing lithium-ion batteries.
The lithium salt currently used in lithium-ion batteries is lithium hexafluorophosphate, which poses a safety risk. Researchers are developing the use of fluoroborate salts, which are showing promise for being much safer. Universities within Australia are working with industry on research and development of products. Leveraging that research with strong manufacturing cooperation would allow Australia to develop world-leading products that could create huge benefits for both our economy and the health of our planet.
The Future of Battery Technology
Sodium-Ion Battery Innovation
The move to renewable energy and storage to power our cars, homes, electronic devices, and everything we rely on for our daily lives, is dependent not only on our ability to build batteries that are cheaper, safer and more efficient but also to build them at scale.
Key advantages:
Cost-effective alternative
Environmental sustainability
Enhanced safety features
Manufacturing compatibility
While lithium-ion batteries have dominated the energy storage landscape for years, issues like limited lithium resources, rising costs and environmental concerns have led researchers and companies to explore sodium ion batteries as a promising alternative.
Lithium-ion vs. Sodium-ion Batteries: Key Differences
Feature
Lithium-ion Battery
Sodium-ion Battery
Applications
EVs, mobile devices
Grid storage, scooters, buses
Cost
Higher
Lower
Resource Availability
Limited (Lithium)
Abundant (Sodium)
Energy Density
Higher (Compact)
Lower (Bulkier)
Environmental Impact
Higher (Heavy metals used)
Lower (Easier to recycle)
Safety
Prone to overheating
Less prone to overheating
Researchers at the University of Wollongong (UOW) Institute for Superconducting and Electronic Materials (ISEM) are continuing to develop new materials and processing techniques that will enable a major step forward in the development of sodium-ion batteries to be used as a viable alternative for large-scale storage where the size of the battery is less of an issue.
Material Properties Optimization
Are Sodium-ion batteries a good choice?
Sodium-based materials are emerging as a significant trend in the battery market primarily due to the limitations of traditional lithium-ion batteries and the growing demand for alternatives. Although sodium-ion batteries tend to have a lower energy density meaning they are bulkier and heavier compared to Li-ion batteries which can store more energy for a given volume or weight, sodium is far more abundant and cheaper to extract.
Sodium-ion batteries don’t require heavy metals to produce – making them easier to recycle and having less impact on the environment. Sodium ion batteries are less prone to overheating offering safety advantages over lithium-ion batteries. They are ideal for stationary applications such as a grid-scale power station and modes of transport that aren’t required to travel long distances, such as electric scooters or electric buses.
Given the significant benefits Sodium-ion batteries offer and the fact that they work in a way similar to Li-ion batteries, they are a simple alternative to integrate into existing battery technologies and manufacturing processes.
Optimised battery material properties
Particle Shape Importance
Particle shape plays a critical role in the performance and manufacturing of sodium-based batteries as well as impacting several key factors that influence the efficiency, safety and durability of batteries.
Spherical particles provide a more controlled and consistent surface area often leading to better packing density and uniformity. Irregular particles might offer more surface area but can result in uneven reactions and inconsistent battery performance. Spherical particles offer smoother and more predictable pathways for ion transport improving the batter’s efficiency, while irregularly shaped particles can create longer pathways which might slow down ion transport and reduce the charge and discharge rate.
Spherical particles provide a more controlled and consistent surface area, often analyzed using SEM and TEM techniques, which reveal intricate details about particle morphology and structure.
Impact of Particle Shape on Battery Performance and Manufacturing
Particle Shape
Impact on Manufacturing
Impact on Battery Performance
Well-Defined Shapes
Creates thicker, uniform electrodes
Retains conductivity and enhances energy density
Spherical
Easier to process and coat
Improves ion transport and efficiency
Irregular
Harder to achieve uniform distribution
May slow ion transport, reducing charge rates
Uniform and well-defined shapes such as spheres are generally easier to process mix and coat during the production of battery electrodes. Highly round particles can help create thicker more uniform electrodes that retain good conductivity and ion transport characteristics, while irregular particles may limit the electrode thickness due to poor packing and uneven distribution reducing the achievable energy density.
In the sodium-based battery industry controlling the particle shape of powders is crucial for maximising battery performance efficiency and durability.
Advanced Analysis Technologies
Morphologi 4-ID for automated particle shape analysis
The Malvern Morphologi 4 combines the power of optical microscopy with sophisticated software algorithms to analyse and quantify particle shape (or size). Unlike traditional microscopy, which requires manual operation and analysis, automated optical imaging can capture the shape, size, texture, and distribution of thousands of particles at once.
Using Morphologi 4’s fully automated image analysis capabilities, users can measure circularity, elongation/aspect ratio, circular Equivalent (CE) diameter, transparency and more for particles as small as 0.5 μm, and sample sizes from 10,000 to 500,000 particles.
In addition, with the Morphologi 4-ID, these automated static imaging capabilities can be combined with Raman spectroscopy, enabling users to simultaneously measure particle size, shape, and chemical identity on one platform.
With the demand for batteries increasing rapidly, more and more manufacturers will need automated optical imaging in their quality-control toolbox. Instruments like the Morphologi 4 can help solve this often-overlooked piece of the battery-manufacturing puzzle.
Importance of particle size analysis
Ensuring that the particles used in battery materials are correctly sized is essential for problem-free manufacturing and battery performance. From optimising the flow of battery slurries, the packing density and porosity of electrode coatings, and charge rate capacity and cycling durability of battery cells – it is important to have an accurate and reliable measurement of the material particle size distribution. See the webinar for more information.
Mastersizer 3000+ for Particle Size Distribution
Key Features:
User-friendly interface
SOP Architect capability
Real-time measurement optimisation
Data Quality Guidance Software
Building on the success of our Mastersizer 3000 laser diffraction instrument, the new Mastersizer 3000+ with its added features, is ideal for customers that require access to near-instantaneous insights into particulate mixtures for their battery research and production operations. The user-friendly interface takes the guesswork out of particle size distribution measurement.
By passing a laser beam through a dispersed particulate sample, the Mastersizer 3000+ laser diffraction system rapidly determines the size and proportion of the particulates based on Mie’s theory of light scattering. This enables users to optimise the properties of battery slurries, electrode coatings, and battery cells quickly and reliably, even in a production environment – and the Mastersizer 3000+ makes this easier than ever.
The SOP Architect feature guides even first-time users through the method development process, while the Measurement Manager helps users optimise measurement conditions in real time for particles from 10nm to 3.5mm in size. When users receive their results, they can consult Mastersizer 3000+’s Data Quality Guidance software to identify potential data quality issues and receive suggestions for solutions – just like having an expert there available to assist with the measurement process and data interpretation at all times.
Comparison of Morphologi 4-ID and Mastersizer 3000+ Features
Feature
Morphologi 4-ID
Mastersizer 3000+
Software Features
Automated image analysis
SOP Architect and Data Quality Guidance
Application
Particle shape and chemical identity
Particle size distribution
Technology
Optical microscopy + Raman spectroscopy
Laser diffraction
Particle Size Range
0.5 µm and up
10 nm to 3.5 mm
Would you like to learn more about our new battery technology and battery analysis solutions? Contact our team for expert consultation.
To learn more about these innovations and discover even more features of the Morphologi 4ID and Mastersizer 3000+, Contact us.
This is an exciting time for battery R&D and manufacturing in Australia. In the recent Federal budget, the Australian government unveiled its National Battery Strategy, aimed to position Australia as a competitive battery producer. The additional funding proposed is aimed to encourage battery production, spread over seven years and administered by the Australian Renewable Energy Agency (ARENA).
The scheme, known as “Battery Breakthrough,” will commence soon as the government works with industry stakeholders and focuses projects on raw minerals, energy storage, industrial batteries, and standards development. Australia is envisioned to become a “renewable energy superpower” by moving beyond a traditional “dig and ship” economy. Despite supplying half of the global lithium, Australia currently produces less than one percent of the world’s processed battery components. The National Battery Strategy aims to change this by creating well-paid, secure jobs in the battery technology sector.
ATA Scientific together with their innovative manufacturers like KRUSS Scientific provide a wide range of technology that can help advance understanding of batteries and battery systems, and to engage in the current and next generation of devices and applications.
Here we introduce some of the current major challenges associated with battery production and discuss the latest technologies available for ensuring high quality battery manufacturing.
The life expectancy of lithium-ion batteries is closely linked to the coating adhesion strength of lithium-ion battery electrodes. Testing the adhesion strength allows us to predict the mechanical bond created is suitable before it is actually used, saving time and money.
In cell production there are many coating and bonding steps that occur. Understanding the surface science of each step is crucial for achieving high quality batteries. Typically the process starts with active binder material and the conductive agent together with solvent mixed together in specific mass ratios to create a slurry. This electrode slurry is then applied to a current collector foil and dried to remove excess solvent. The calendaring step compresses the porous electrode to the desired thickness by passing them through two rotating barrels. Calendering decreases the electrode’s porosity, which leads to an increase in energy density due to a smaller volume, as well as improvements in adhesion and coating uniformity. The electrodes are then cut into the desired shapes, stacked with separators in between and electrolyte is injected and filled to form a battery cell. Ensuring that the liquid fully permeates and wets the pores is an important step to ensure optimum mass and charge transport.
What are typical challenges in electrode production?
The slurry ingredients and preparation plays an important role in final coating which affects the performance of the battery produced. The uniform dispersion of active material and binder is important because it influences the electrochemical properties which can affect battery capacity, voltage, stability and lifecycle. The drying step can introduce thermal and mechanical stresses affecting the adhesion of the fluid with the active surface. The cutting and calendaring can also cause defects in the coating which has a strong impact on pore size affecting the wetting behaviour and therefore the electrode functionality. In addition, complete wetting of battery electrode pores during the electrolyte filling process can be a major bottle neck. How long this takes depends on the entire process from chemical composition of the raw materials, the layer thickness and density, to the wetting properties of the electrolyte.
Cell production process – coating and bonding
Coating and bonding steps are also present during the assembly of individual cells into packs or modules. Individual cells typically wrapped in an aluminium housing have a functional coating. A heat shield is added in between cells to contain thermal conditions and prevent overheating. These are then stacked with adhesive to form a module together with side covers and cooling plates. Several modules are joined together on a base plate and finally sealed with a cover. The adhesive used needs to able to withstand expansion and contraction during the charging and discharging cycles and be applied evenly without air pockets to prevent overheating that can compromise performance or in the worst case can be a severe safety issue.
Surface science can help solve these challenges to advance battery production
For Li-ion battery production, contact angle measurements and interfacial testing can be used to optimise key properties such as the adhesion of housing seals, which results in improved battery durability and enhanced safety. Interfacial testing can help differentiate and optimise batteries with key benefits including longer battery life and quicker charges. For example, reducing electrolyte surface tension to improve saturation of electrode and separator membrane helps increase overall battery performance. Interfacial testing equips researchers to not only properly wet the electrodes, but also speed up the historically time-consuming process.
Optimising wetting and adhesion applied to battery production
Interfacial tension measurements assess the physical and chemical phenomena that occur at the interface of two phases (i.e., solid-liquid, solid-gas, liquid–gas). Despite being a core part of advanced materials design, interfacial testing is vastly underutilised in Li-ion battery development and production. The interfaces between the electrolyte solution, separator membrane, electrodes, and current collectors have significant influence.
Drop shape analysers help analyse wetting of electrodes, determine the saturation of the separator membrane and can help optimise the coating of current collector with the slurry. Tensiometers can provide further benefits by measuring the dispersibility of electrode materials in the slurry, they can optimise the wetting rate for multiple battery components and monitor the electrolyte surface tension for a flawless ion transfer.
When considering basic principles for wetting, surface tension and adhesion, achieving optimum wettability of the solid components by the electrolyte solution yields optimum battery performance.
Interfacial testing can provide 5 important opportunities for improvement.
1. Wetting the separator membrane
Lithium ions travel through the electrolyte to penetrate the membrane; a poorly wetted membrane inhibits electrolyte saturation. Separator issues carry a high safety risk and can lead to fires. Using an optical tensiometer, Sessile drop or Wilhelmy method measurements can be applied to determine the electrolyte contact angle on the separator membrane. Results can enable faster, more thorough saturation of separator which results in improved battery performance, quicker ROI, and increased safety.
2. Wetting the electrodes
Complete wetting of porous electrode material by the electrolyte is crucial for capacity and high current charging. The electrolyte wetting process is a major bottleneck, as it can take hours or even days. Contact angle of the electrolyte on porous electrode material with the Washburn method or optical high-speed recordings (sessile drop) can be applied to achieve faster, more complete wetting of the electrode can reduce processing time ensuring a high-capacity, high-current charging battery.
3. Wetting the current collector by electrode slurry
An optimum charge transfer requires complete and even distribution of the electrode slurry onto the current collector. Improper contact or uneven layering of the electrode slurry on the collector foil causes irreparable loss of battery performance. Contact angle of the electrode slurry on collector foil by sessile drop or Wilhelmy method can help achieve an even spread of electrode to optimise charge transfer to improve process efficiency and reduces risk of irreparable performance degradation.
4. Surface tension of the electrolyte solution
The higher the surface tension of the electrolyte, the lower the wettability of the electrode material and separator membrane. Tensiometry with ring-/plate-method or pendant drop and dynamic analysis measured via bubble pressure can help users to reduce surface tension to improve saturation and optimise the compatibility of the electrode and separator membrane to increase battery performance.
5. Adhesion of the housing seal
Battery housing seals need to be very durable and reliable. Adhesion failures can lead to damage and safety risks. Adhesion analysis via contact angle testing (i.e. sessile drop) and tensiometry can help improve battery durability and enhanced safety.
KRUSS provides a wide variety of advanced interfacial testing technologies all controlled using a single powerful collaborative software platform.
KRUSS Tensiio is a high performance automated tensiometer designed to measure surface and interfacial tensions with high precision and efficiency. Its advanced features make it particularly useful for various aspects of battery research and development including electroyte formulation and electrode material optimisation. The ability to perform dynamic surface and interfacial tension measurements allows researchers to study how these properties change over time and under different conditions, such as temperature variations and the presence of impurities. This provides deeper insights into the stability and performance of battery components under real-world conditions.
KRUSS DSA100 Drop shape analyser measures contact angle, surface tension, and interfacial tension to understand wetting and adhesion behaviour. The device typically uses high-speed cameras and advanced software to analyse the shape of a liquid droplet on a solid surface, providing precise data about surface properties. It can be used to optimise wetting of electrodes and separators, Electrolyte compatibility, Homogeneity of slurry coatings and quality control during manufacturing.
The contact angle measurement provided by the KRUSS DSA100 helps to determine how well a liquid (like an electrolyte) spreads on a solid surface (like an electrode). Lower contact angles indicate better wettability, which is desirable for uniform coating and efficient electrode performance. By analysing how different surface treatments affect wettability, electrode surfaces can be optimised to enhance performance and longevity.
KRUSS Ayriis offers a mobile, stand-alone, 3D contact angle instrument with easy-to-exchange rechargeable batteries and prefilled cartridges. The Ayríís is ideal to quickly determine the wettability of solid materials before coating or bonding.
KRUSS MSA One click SFE provides portable contact angle and surface energy measurement, directly on production lines or field locations. Simple to setup and operate for quick assessments the MSA is ideal for quality control without damaging samples.
If you are eager to explore the capabilities of the KRUSS surface science technologies, we are delighted to offer you a personal demonstration. Request a guided demo using your own samples with a product specialist.
Back in 2017 Jacques Dubochet, Joachim Frank and Richard Henderson had won the 2017 Nobel Prize in chemistry for their work developing cryo-electron microscopy technology – or cryo-EM. The technique allows images to be taken of protein components that are reconstructed into movie like scenes that show how biological machines work. It generates atomic resolution 3D models of molecules that are not able to be seen using other structural biology techniques to gain insight into things like receptors that are therapeutic drug targets, molecular motors that deliver cargo to different parts of the cell and emerging viruses that lead to human disease.
While X-ray crystallography is widely known and used as the gold standard for generating high-resolution biomolecular images, this older technique requires the formation of ordered crystals. Proteins must first arrange together in repeating patterns which can be challenging. With cryo-EM, there’s no need for biomolecules be ordered in this way.
Cryo EM saves time, but it can be very expensive and requires massive amounts of computational power and data storage, so many of these technologies are only available at major microscopy facilities.
In addition, sample preparation for cryo-EM can be a demanding and expensive process, requiring several rounds of purification and screening to isolate the macromolecules of interest. Negative stain electron microscopy (EM) is one of the established tools for the initial screening of purified samples prior to imaging using transmission electron microscope (TEM) to study particle size, morphology, concentration, and agglomeration. With the introduction of the desktop scanning transmission electron microscope (STEM), an alternate process for sample screening has been developed that is faster and more cost-effective than the traditional methods.
So, the question is, how does a desktop STEM system help enable the specialised and expensive resources required for cryo-EM to be more broadly available to researchers across the country and around the world?
What is STEM?
Scanning transmission electron microscopy (STEM) is a high-resolution imaging technique used to visualise structure and composition of materials and biomolecules. It scans a focused electron beam across a thin sample collecting signals based on scattering angle to produce bright field (phase contrast) or dark field (compositional contrast) images. When paired with energy-dispersive X-ray spectroscopy (EDS) it can provide elemental composition.
Samples for STEM imaging need to be electron transparent and typically 100 nm thickness or less to minimise scattering and improve signal to noise.
What is the difference between STEM and TEM?
In an SEM, the secondary electron (SE) and backscattered electrons (BSE) are used to acquire images of a sample’s surface whereas in a TEM, the transmitted electrons are detected to produce a projection-image through a sample’s interior. STEM can be thought of as a hybrid between SEM and TEM, where a thin sample is scanned with a focused electron beam (like an SEM) and the transmitted electrons are detected (like in TEM) at each point to acquire a high-resolution image of the internal structure of the sample.
Why use STEM-IN-SEM?
When compared to traditional TEM techniques, integrating STEM-in-SEM provides several advantages which is driving its growth in popularity. The resolution meets most application’s needs and produces results much faster than it can be obtained using a TEM, improving workflow throughput significantly. Additionally, SEMs operate at low acceleration voltages which can improve imaging contrast (especially for biological samples like carbon nanotubes or biological tissue) and causes less beam damage to the sample enabling longer working windows for delicate samples. STEM structural information can be easily correlated with BSD and SED images typically provided using SEM. The technique is also much less sensitive to sample thickness and is easier to prepare than TEM, meaning thicker, uneven and unstained samples can be quickly and easily imaged.
Sample preparation techniques used in Electron Microscopy
Two techniques are commonly used – negative and positive staining.
First developed in the mid-twentieth century, the negative staining technique uses a protocol for staining virus particles with heavy-metal salts and observing them in a TEM. The particles in a sample are absorbed onto the grid and then a stain is applied to envelope the particles. Due to repulsion between the negative charges of the stain and cell surface, the dye will not penetrate the cell. In negative staining the stain fully envelops the macromolecular complex, resulting in the complex appearing white on a dark background. The ease of grid preparation and high contrast offer an ideal method for the assessment of particle size, morphology, concentration, and agglomeration.
Similarly, the positive staining technique has been used since the late 1950s for enhancing contrast of biological samples (tissues and cell structures, viruses etc). Thin sections of samples fixed in glutaraldehyde and embedded in epoxy resin are placed onto copper grids and incubated in heavy metal salt solutions that react with cell structures before imaged using a TEM. Positive staining results in a small amount of stain forming a thin shell around the molecule, meaning the sample appears dark against a light background.
A conventional TEM is generally used to visualise the stained samples. This results in expensive equipment being tied up in screening samples rather than their intended application in high-resolution imaging. The facility costs and frequent maintenance costs can be significant, imposing financial burdens on principal investigators who are relying on it for sample screening. The learning curve on how to use a TEM can be rather steep with new users taking several days to weeks to become proficient enough to operate a TEM independently. Therefore, exploring alternatives to dedicated TEM instruments is an appealing choice for those who want to maximse the benefits of stain EM for sample screening.
The Desktop Phenom Pharos FEG- SEM with STEM detector
Desktop Phenom Pharos FEG-SEM is a compact, easy to use imaging system that can be used as a quick imaging tool that complements and helps free up valuable time on larger, more complex and much more expensive EM imaging systems.
When equipped with the STEM detector Phenom delivers ultrastructural characterisation with resolution close to a TEM, but with a larger field of view. The resolution meets most application’s needs and its ease of use allows images to be generated by user of any experience level in as little as one minute from sample loading. This new imaging modality provides immense value to a variety of fields including nanomaterials, catalysts, pathology, and batteries.
The Phenom Pharos Desktop SEM with a STEM detector is a plug-and-play accessory that integrates a segmented solid-state detector into a sample holder. It is compatible with standard EM grids and is capable of independent collection of bright-field (BF), annular dark-field (ADF), and high-angle annular dark-field (HAADF) signals.
Options for STEM imaging
Phenom SEM can be programmed to collect data in an automated fashion, allowing for quick inspection of the entire grid. This allows users to very quickly and easily collect images containing hundreds of thousands of particles that can be used for statistical analysis.
The sample holder is compatible with standard 3 mm TEM grids. A clamp-based mount ensures that delicate samples are safely loaded and securely held in place during handling. The STEM detector and its electronics are conveniently integrated into the holder. Switching between conventional SEM and STEM imaging modes is as simple as loading a new sample. Users can obtain a time-to-image of less than 40 seconds and select from three standard STEM imaging modes; bright field (BF), dark field (DF) and high angle annular dark field (HAADF); or explore custom configurations.
Bright Field (BF)
BF imaging collects on-axis electrons scattered by the sample. Contrast depends primarily on sample thickness and composition, where thicker areas containing heavier elements appear darker. With improved sensitivity to light elements, BF mode can be particularly useful for studying organic samples. For example, when investigating carbon nanotubes, the SED image may not be able to easily locate metallic catalyst particles, however by using the BF STEM on the Pharos SEM these particles are clearly shown as dark spots.
Dark Field (DF)
DF imaging detects off-axis electrons that result from relatively lower diffraction angles. Image contrast depends on thickness and atomic number with brighter areas corresponding to local mass-thickness. DF imaging is more sensitive to atomic number differences in lighter elements and is useful for a broad range of samples.
High Angle Annular Dark Field (HAADF)
HAADF imaging collects the off-axis signals at the highest scattering angles and is most sensitive to atomic number contrast, or Z contrast. HAADF is particularly sensitive to heavier elements such as metal atoms. This mode can be used to detect features that are harder to visualise with the other imaging modes.
Collaboration with NSW Health Pathology and the Ingham institute for Applied Medical Research
Electron microscopy plays a major role in diagnosing renal and rare diseases, however high costs can limit its access. Professor Murray Killingsworth from NSW Health Pathology’s Liverpool lab and Dr Tzipi Cohen Hyams from the Correlative Microscopy Facility at the Ingham Institute for Applied Medical Research are working with ATA Scientific and Thermo Fisher Scientific International to develop the Phenom Pharos FEG-SEM with low kV STEM imaging and assess how it may be used for high resolution ultrastructural characterisation of soft tissue and cells for cell biology and pathology. The team recently won “Recognising our Pioneering Spirit” Award for their pioneering work at the 2023 NSW Health Pathology Awards! The group will also be presenting their latest findings and demonstrating the Phenom Pharos together with ATA Scientific during the UltraPath XXI conference 2024 to be held in Sydney (September 30th – October 4, 2024).
If you are eager to explore the capabilities of the Phenom Pharos FEG-SEM, we are delighted to offer you a personal demonstration. Request a guided demo using your own samples with a product specialist.
Lipid Nanoparticles (LNPs) continue to grow in popularity as they enable the efficient delivery of therapeutic payloads such as RNA. LNPs as delivery vectors hold immense promise for nucleic acid-based gene therapy, oncology, and vaccine development. Although LNPs can be manufactured using cell free production processes with the potential for rapid scaling, they can be analytically challenging to develop and manufacture due to their complex structure.
LNPs are generally composed of four main components: cholesterol, phospholipids, a PEG-conjugated lipid, and a synthetic ionizable cationic lipid. LNPs, generally with a diameter of 50–100 nm, are formed by controlled nanoprecipitation of the lipids around the RNA molecules. The existing models state that the ionisable lipid first surrounds the RNA by electrostatic interaction with the anionic phosphate groups. The cholesterol and phospholipids contribute as structural components, before the PEGylated lipid inserts into the LNP surface, with the PEG group facing outwards, providing a hydration layer, and making the LNPs less prone to early elimination by the immune system, increasing circulation time in the blood stream.
The PEG monolayer is an essential component of most mRNA-LNP formulations. PEG provides multiple vital functions, such as minimising protein absorption and extending circulation times to help the vector protect and deliver nucleic acid therapeutic cargo to the desired target. However, the PEG monolayer can reduce the electrostatic repulsive forces between particles, resulting in lower colloidal stability of the drug product.
Measuring a range of critical quality attributes (CQAs) is key in determining stability and can provide insight for optimising the drug design and manufacturing process. Key attributes include Size, Polydispersity, Concentration, Surface charge, Payload information and Thermal stability.
Analytical tools to optimise Lipid-based nanoparticles (LNPs) development
The exponential use of LNPs in research has highlighted the need to better understand and control the stability of LNPs from formulation development to manufacturing. The size, size distribution or polydispersity index (PDI) are indicators of the success of the particle formation. Empty LNPs are typically found to be unstable over time and always show higher PDI values. In addition, the final size and size distribution will depend on the success of encapsulation of the payload like which influenced by the buffer composition used during and after the formulation process. This indicates that the understanding and control of internal structure and micro/nano environment inside the LNPs is very important to be able to understand and optimise the stability of such a delivery platform.
Established Light scattering techniques, such as Dynamic Light Scattering (DLS) and Nanoparticle Tracking Analysis (NTA), are commonly used to measure LNP physicochemical properties, including particle size, particle size distribution, PDI and particle concentration, which relate to LNP CQAs.
LNP Size
LNP size is a critical attribute for the function of LNP therapies, as it can determine tissue penetration and efficacy. It can also help you identify potential instability in your sample (typically displayed as aggregation or a change in particle size) due to external stresses, such as storage conditions or processing steps. There are 3 analytical techniques that can be used to efficiently and reliably measure LNP size – namely single angle Dynamic Light Scattering (DLS), Multi-Angle Dynamic Light Scattering (MADLS), and nanoparticle tracking analysis (NTA). These techniques cover a wide particle size range.
DLS is a non-invasive, well established technique for measuring size and size distribution of particles in a liquid. While DLS is not a high-resolution technique, it is accurate, reproducible, fast, and requires no method development.
In DLS, a laser light illuminates particles in a dispersion which scatter light in all directions. Measuring the scattering intensity fluctuations gives the velocity of the Brownian motion, which is then used to calculate the particle size using the Stokes-Einstein relationship. The Malvern Zetasizer can detect particles ranging from 10s of µm to below a 1 nm, meaning it can measure even the smallest mRNA-LNPs (which typically range from ~50–150 nm). DLS offers a wide concentration range and is used as a rapid screen for sample degradation or aggregation which is particularly useful for LNPs as they often occur in very high concentrations. In addition DLS is non destructive and requires low sample volumes (~20 µl) meaning you can preserve your precious samples and re-use them in other assays.
However, larger aggregates tend to scatter more light in the forward angle, meaning that it can be difficult to detect the presence of LNP aggregates. For this reason, the scattering angle used should always quoted.
While DLS works by measuring samples at a single angle, Multi-angle dynamic light scattering (MADLS) measures samples at multiple angles, offering improved resolution as well as angle independent particle size distribution. MADLS provides a more accurate representation of the different populations present in the sample, and a higher resolution size determination of multi-modal samples. It can also consistently detect low numbers of larger aggregates (which are inherently harder to detect with single angle DLS, as discussed above).
Like DLS, MADLS can detect even the smallest LNPs, with a detectable size range of 10 μm to 1nm and below. Using a known refractive index is a key consideration for using MADLS as is the absorption of the sample material and dispersant. Since RNA can change the refractive index of a sample, users need to know if samples contain RNA or not. To do this, a RiboGreen assay can be used to calculate the refractive index or it can calculated from compositional analysis data using Size Exclusion Chromatography (SEC).
LNP Concentration
Nanoparticle Tracking Analysis (NTA) – NanoSight Pro
Using the properties of both light scattering and Brownian motion Nanoparticle tracking analysis (NTA) can determine nanoparticle size distribution of samples in liquid suspension. For this technique, a laser beam illuminates particles in liquid suspension which are loaded into a sample chamber. Particles in the path of the beam scatter the light, which is then collected by a microscope and viewed with a digital camera. The camera captures a video of the individual particles moving under Brownian motion, with software analysing many particles individually and simultaneously, particle-by-particle. By using the Stokes Einstein equation, NTA software then calculates the hydrodynamic diameters of the particles. NTA does not require any knowledge about the material such as RI or absorbance. This orthogonal technique described by the ISO standard 19430 tracks particles in real time to provide size, concentration and fluorescence data. NTA is a higher resolution technique when compared to DLS and MADLS and can be particularly useful when analysing polydisperse LNP samples and to detect subtle changes in the characteristics of LNP populations. NTA uses very low volumes (1 μl, before dilution) which is fully recoverable and requires little sample preparation, however is not suitable for particles below 50nm.
In addition to size and concentration, NTA also provides scatter intensity, which resolves adjacent populations of particles and differentiates materials of sufficiently-differing refractive indices. This unique ability potentially allows the user to probe whether nanoscale drug delivery structures such as LNPs vary in their contents, i.e. empty LNPs may have a lower refractive index (light scattering power) than those loaded with a higher refractive index material. This would allow them to be differentiated even though they may be of very similar sizes.
In addition, fluorescence detection capability allows differentiation of suitably labeled particles from complex backgrounds.
Size Exclusion Chromatography (SEC) – OMNISEC Multidetector system
To achieve more in-depth characterisation of the different size populations in a polydisperse LNP sample, it is essential to use a separation technique like size exclusion chromatography (SEC) coupled with multiple in-line detectors. Using SEC ahead of size measurement improves the resolution of the identified populations. Multi-detection SEC works by separating molecules based on their hydrodynamic radius as they pass through a chromatography column, with larger components being eluted first followed by smaller ones. After the separation step, one or more advanced detectors (such as refractive index, UV/Vis-PDA, and right-angle light scattering and multi-angle light scattering, RALS and MALS) can be used to gather further information about the sample including size, molecular weight, and aggregation profile.
SEC with in-line detectors is a key tool for LNP payload quantification
Understanding the therapeutic payload of LNP vectors particularly how much of the payload has been incorporated into the LNP is critical to ensuring patients receive the correct therapeutic dose. Traditional analytical methods for quantifying LNP vector payload can be labour intensive, require complex method development, where protocols are not easily transferable between different LNP formulations. SEC with multiple detectors has emerged as a key approach for LNP quantification.
By observing the sample’s concentration using both the RI and UV/Vis-PDA detectors, equations can determine the concentration of two components within a single sample (in this case, LNPs and the genetic payload). By comparing the concentrations of the two components, you can then obtain the weight fraction (%) of the LNP payload. SEC-LS has several benefits and does not require the dedicated reagents needed in traditional methods.
Optimal surface charge (or zeta potential) is a key attribute in the development of LNP therapies where the value depends on the target tissue. Zeta potential will influence an LNP’s solubility and interaction with cellular membranes. Knowledge of the surface charge can therefore help predict the in vivo fate and activity of an LNP therapy.
Zeta potential can offer insight into its surface chemistry (and any modifications it may undergo). Several factors can influence the measured zeta-potential including pH, ionic strength and the concentration of other components in the solution (such as additives, coagulants, and surfactants).
Electrophoretic Light Scattering (ELS) is a key tool that can be used to measure the zeta potential of LNP samples. ELS involves electrophoresis where a dispersion is introduced into a cell containing two electrodes, and an electrical field is applied across them. Particles with a net charge (or zeta potential) migrate towards the oppositely charged electrode with a velocity (known as the mobility) related to their zeta-potential. A laser is passed through the bottom of the cell, with the charged particles producing scattered light that is frequency shifted in proportion to their velocity. By detecting the frequency shifts, we can then calculate the zeta potential.
When it comes to LNP samples, ELS is most often used to validate the apparent surface charge to evaluate formulations for stability and predicted uptake efficiency in target tissues. However, LNP therapies which are prepared in physiological buffers, are high conductivity which pose significant challenges. High-conductivity samples interfere with accurate zeta potential measurements in a number of ways including heating effects, electrode polarisation, electrode degradation, and sample degradation. Also, simply applying a voltage across a high-conductivity sample can cause it to aggregate. The challenges of high-conductivity samples can be prevented with the diffusion barrier method.
When working with high-conductivity samples the diffusion barrier separates the particles in a sample from the electrodes by inserting a small ‘plug’ or aliquot (~20–100 ul) of sample into a folded capillary cell that already contains the same buffer that the sample is prepared in. This isolates the sample from the electrodes. Since the sample is not directly in contact with the electrodes, sample integrity is maintained, and electrode degradation is minimised. Furthermore, it reduces the amount of sample required for zeta potential measurements.
LNP Structure
Beyond size and size distribution, structure and structural stability are the key attributes of a biotherapeutic drug determining its ability to consistently deliver and maintain the desired function throughout the manufacturing process, administration, and longer-term storage. This makes analysis of structure and stability a critical task combining multiple assays which together inform the selection of candidates and formulation conditions. While size and polydispersity measurements conducted over time or as a function of temperature can inform on stability of particles in RNA-LNP samples, they need to be complemented by direct assessment of the intra-particle structure and structural stability of RNA-LNP. RNA is the crucial structural component for the assembly of lipids in LNPs, so structure and structural stability are key properties ensuring desired function and safety of LNP formulations and their cargo. Slight changes in formulation or storage conditions can affect the way the components interact and assemble into an RNA-LNP complex.
Temperature change is a common stress factor for LNP-based therapies throughout production, storage, and application. By monitoring thermal stability profiles, the intrinsic structural stability of RNA-LNPs can be assessed. This can help track changes between batches and stress conditions, to alert users to any changes in higher order structure.
Differential scanning calorimetry (DSC) is a valuable and well-established tool for monitoring the thermal stability and thermally induced transitions of biomolecules and biomolecular assemblies including lipid-based delivery vectors and nucleic acids. DSC works by measuring the heat change associated with a sample’s structural transitions when heated at a constant rate.
Consisting of two cells — a reference cell with buffer, and a sample cell with the sample solution, the DSC system is designed to maintain the two cells at the same temperature as they are heated. The absorption of heat that occurs when a molecule undergoes a structural changes causes a temperature difference (ΔT) between the cells, resulting in a thermal gradient across the Peltier units (or thermoelectric modules). This leads to a voltage, which is converted into power and is used to control the Peltier to return ΔT to 0°C. The output of a DSC measurement is a thermogram which provides multiple parameters for describing the thermally induced transitions of samples.
Tm (thermal transition midpoint), also known as the melting temperature of the sample. The higher the Tm, the more stable the sample. Shifts in Tm can indicate structural heterogeneity of the sample, or degradation.
Tonset (thermal transition onset) is the onset of a thermal transition event. The lower the onset, the higher the occurrence of unfolded species at this sample condition, and the higher the probability of aggregate formation linked to the unfolded species. This information can help formulators understand the temperature ranges to avoid to maximise sample stability.
T1/2 (the width of thermal transition at half-height): The T1/2 reflects the extent of cooperativity of the thermal transition. The narrower the transition, the more cooperative it is.
Enthalpy change (ΔH) is the total energy spent in a thermal transition, and reflects the relative amount of native biomolecule in your sample.
Higher order structure (HOS): The entire thermogram shape can give us a fingerprint of the molecule’s HOS and provide a stability profile of biomolecules during development.
Reversibility: While not a feature of the thermogram itself, the reversibility of thermal transitions is another key aspect of structural transitions observed with DSC. Reversibility reveals the ability of biomolecules to re-adopt their native structure upon cooling. Low reversibility is characteristic of unfolding events accompanied by aggregation and/or chemical degradation.
Therefore DSC results can give us insights into the functional efficiency, stability and degradation, modifications, and half-life of the nucleic acids and oligonucleotides in question, helping formulators to design and select optimal RNA variants for therapies.
MMS is A Game Changer in RNA-Ligand Analysis – Aurora series
Microfluidic Modulation Spectroscopy (MMS) and provides ultra-sensitive, ultra-precise structural analysis of a wide range of biomolecules like proteins, peptides, antibodies, mRNA, ADCs, and AAVs. It measures structural changes due to buffer/pH/formulation, stress, point mutations, binding partners, and storage conditions. When compared to CD or FTIR, MMS can detect structural change 20x faster and with 30x greater sensitivity. MMS combines a high-power Quantum Cascade Laser with real-time buffer referencing. This provides the power to analyse both low and high-concentration samples, in formulation buffer without excipient interference, to detect small but critical structural changes.
The Benefits of Aurora MMS
What sets this system apart is its ability to perform these analyses with minimal sample requirements (50µL of sample), high sensitivity and exceptional accuracy – all within an automated space saving unit that is simple to operate. The Aurora MMS system provides a wealth of information about the protein’s secondary structure, allowing users to gain insights into its folding, stability, and conformation. Proteins can be analysed at concentrations as low as 0.2 mg/mL to >200 mg/ml, a capability that was once considered impossible with traditional methods.
LNP: In summary
LNP size is a critical determinant of its ability to penetrate tissues to deliver payloads, and can indicate sample instability. DLS, MADLS, and NTA offer accurate and reliable ways to measure LNP size and PDI across a range of particle size ranges, and with different resolutions. Choosing the right tool depends on several considerations, including the size and polydispersity of LNP samples, sample concentration and available sample volume. MADLS, NTA, and SEC-LS provide valuable concentration measurements across a wide range and offer measurements orthogonal to mass-based techniques. The technique choice depends on the size of the LNPs, the amount of sample available (NTA can access lower concentrations), and resolution needed (MADLS offers a good quick, rough screen).
ATA Scientific offers a suite of robust, accurate, and highly reproducible biophysical techniques to help better characterise the critical quality attributes of LNPs — from size and polydispersity to surface charge and composition. These tools offer powerful, complementary approaches to track the development and manufacture of LNP-based therapies, delivering deeper insights while also offering opportunities to minimise sample use, save time, and reduce costs.
ATA Scientific is pleased to announce our new partnership with KRÜSS GmbH, a global leader in surface science solutions. This collaboration aims to enhance our product offerings and technological capabilities providing customers with the most advanced surface science measurement services including contact angle meters, tensiometers and foam analysis systems.
Enhancing surface science solutions
With over 30 years of experience, ATA Scientific has established their reputation for supplying and supporting high-quality scientific instruments in Australia and New Zealand. Our passion for finding better solutions together with our customers to advance scientific research and innovation aligns perfectly with KRÜSS’s knowledge and expertise in surface science.
Expanding capabilities to support innovation
This partnership allows researchers and industrial scientists in industries such as materials science, packaging, battery and oil and gas to access the latest surface science technology backed by comprehensive technical support and training. With advanced surface and interfacial measurements, KRÜSS is helping to accelerate innovation in areas such as Lithium-ion battery design and optimised surfaces for packaging, printing, coating, and semiconductors.
“We are thrilled to partner with KRÜSS. This collaboration represents a significant step forward in our mission to provide the scientific community with the most advanced tools available” said Bryn McDonagh, Director of ATA Scientific.
Abhijit Bhoite, Regional Sales Manager Asia, announced, “We at KRÜSS are specialists in interfacial chemistry and the world’s leading supplier of measuring instruments for surface and interfacial tension. I am elated to partner with ATA Scientific in Australia to shape the future of surface science. Their expertise in this industry will enable us to make Surface Science big and to support our customers in this region better”
We are proud to be part of this journey together, joining global customers like Intel, Airbus, BASF, Google, Johnson & Johnson, L’Oréal, Pfizer and Samsung, and sharing our commitment for excellence to support our customers evolving surface characterisation needs.
For more information about this partnership and our expanded product offerings, please contact us.
The latest Aurora TX, powered by Microfluidic Modulation Spectroscopy (MMS) developed by RedShiftBio, fully characterises the structure and stability of RNA, proteins, peptides, and other biomolecules at the touch of a button, including thermal ramping to unlock a greater wealth of insights than ever before.
Aurora TX sets a new standard in biomolecular analysis with background-subtracted measurements of a wide range of biomolecules in the formulation of interest and in concentrations ranging from 0.1mg/mL to >200 mg/mL. This level of accuracy and versatility, coupled with an easy, automated workflow, utilisation of 96-well plates, and fully integrated analytical software addresses the limitations of existing technologies such as CD and FTIR.
Aurora TX empowers researchers to delve deeper into the characterisation of nucleic acids, proteins, and other biomolecules without the need for spectroscopy expertise. With the ability to compare higher-order structures, stability profiles, and similarity profiles, Aurora TX facilitates informed decision-making across various stages of biopharmaceutical drug development, from discovery to quality control.
The most significant development of Aurora TX is its growing application in RNA analysis. With its advanced sensitivity Aurora TX is ideal for nucleic acid characterisation. Researchers can use Aurora TX to detect structural changes to RNA due to sequence modifications, formulation changes and thermal stress. Even structural differences in the payload upon LNP encapsulation and RNA-to-LNP ratio are now measurable, all with walk-away automation.
The integration of thermal ramping in Aurora TX adds a new dimension to biomolecular analysis by enabling researchers to induce high-resolution temperature stress, facilitating the detection of structural changes with precision and repeatability. This feature streamlines the analysis process, saving time and resources for researchers engaged in drug discovery and development.
The Zetasizer Sample Assistant is a new accessory for every Zetasizer Advance system. It automates sample analysis and frees user time from manually changing samples. The result? The same great data quality and versatility you expect from your Zetasizer Advance with even greater efficiency.
Here’s how Zetasizer Sample Assistant makes a difference:
• Improves lab efficiency by minimising lost time between samples
• More efficient sample handling without compromising data quality
• Sample Assistant works together with your existing methods to simplify method transfer or create them in the Method Builder as normal
• Use multiple methods, even on the same sample tray
• Straightforward workflow guides users through maintenance with ease
The great advantage of the Zetasizer is that the entire system is designed holistically. From the instrument itself to the sample cells, everything is designed to ensure optimal data quality without the need to attend the instrument. It allows users to do other tasks while the Assistant is dealing with the samples. The Sample Assistant provides high‑quality sample data that inspires confidence, without the need to be present. It is also easy to upgrade, with no instrument modifications, no time lost when cleaning between samples, and no risk of cross‑contamination.
Mastersizer 3000 already has a reputation as the world’s most trusted particle size analyser for accurate, robust, reliable data that informs critical decision making throughout R&D and manufacturing processes.
Malvern Panalytical’s latest Mastersizer 3000+ offers a significant advancement in particle size analysis, combining decades of trusted expertise with state-of-the-art technology. Seamlessly integrating artificial intelligence (AI) and data science-driven software solutions, this cutting-edge instrument offers a helping hand to users at all proficiency levels. Software solutions for method development support, data quality feedback, instrument monitoring, and troubleshooting advice, help streamline operation and simplify the route to achieve best-quality particle size data, positively impacting product research, development, and manufacturing.
Size sure, is a new addition that delves deeper into sample analysis, which investigates both steady and transient states to ensure the reproducibility of size distribution measurements while shedding light on potential contaminants and other critical factors.
SOP Architect, driven by machine learning algorithms, constructs optimal analytical methods for each sample, complemented by guided workflows. Embedded data quality guidance promptly alerts users to any issues, facilitating swift corrective action.
Smart Manager connectivity provides proactive advice on maintenance requirements, preempting part failures and replacements to ensure uninterrupted optimal instrument performance and minimal analytical downtime.
Mastersizer 3000+ Range:
Mastersizer 3000+ Lab: Entry-level system offering robust size measurements from 0.1 to 1000 microns, empowered by the Mastersizer Xplorer software.
Mastersizer 3000+ Pro: Mid-tier system providing robust size measurements with advanced software experience and automated dispersion options.
Mastersizer 3000+ Ultra: The pinnacle of particle size analysis, offering the widest size range (0.01 – 3500 um) and automation support, driven by the digitally enhanced Mastersizer Xplorer with AI-powered workflow applications, including the new Size Sure measurement mode.
The production of technologies, like most things, is not immune to imperfection, and sure as eggs, as soon as someone makes a product that enjoys popularity, another tries to compete with a new improved variant attempting to cash in on the success without the massive development cost – virtually reverse engineering. The simplest of techniques still has a mountain of scientific theory and engineering to support the design, protected with patents.
What technologies are available now and how do they rate?
In summary I would like to discuss microfluidics, impinging jet mixers, and advanced cross flow mixing, three broad techniques that all have uses and some with very real limitations. The context is the encapsulation of a treatment where the modality is nanoprecipitation, and the consensus of opinion is the method enables mixing rate to be faster than assembly rate that must be achieved in laminar flow. The key to laminar flow is to allow a predictable, repeatable formulation. These techniques were also selected as they all claim to create at scale. Whilst not covered in this discussion, homogenisation, extrusion, and thin film hydration are useful tools worth considering for applications they are suited.
Microfluidics
There has been a veritable explosion of technologies in this area with a range of offerings from simple devices used in research labs to massive companies with global appeal supplying instruments spanning from low volume formulation through to litres for GMP applications. Arguably one of the earliest microfluidic mixer technologies was the Staggered Herringbone Mixer (SHM), a microfluidic channel with a repeating pattern of grooves. Kwak et al1 noted ‘Convex Grooves in Staggered Herringbone Mixer Improve Mixing Efficiency of Laminar Flow in Microchannel’ detailing how the convex pattern from a negative flow pattern was less efficient than the positive pattern that has a concave SHM structure on the bottom of the microchannel. This work built on a body of research over decades, Aubin et al. 2 demonstrated the grooves that are 30% deeper than the channel height have a higher mixing efficiency, given that it promotes spatial homogenisation without increasing the pressure in the mixer.
Fig. 1 Schematic illustration of microfluidic device with 69 cycle numbers of staggered herringbone micromixers (SHM)3 .
Taking this basic design and controlling the inputs seems quite straight forward and indeed it is. Numerous commercial entities have developed systems to various degrees, some as simple as a syringe pump delivering the ingredients and a vessel to catch the formulated product, others are computer-controlled delivery in a dedicated box including ancillary support for drug development. In the context of laboratory R&D, the staggered herringbone Mixer is an interesting option. There is a shortfall though, it has few prospects for scaling up. Some have strung a pile of the SHM in parallel in an attempt to achieve volume – not very useful in a GMP environment to produce thousands of litres. While microfluidic technologies have many advantages, one key disadvantage is the limited solvent compatibility for devices made of polydimethylsiloxane (PDMS). While these materials are common for devices fabricated by soft lithography, they can interact with organic solvents by swelling and deforming the intended structures, making them unsuitable for many formulations 7. They also give problems because of leachables / extractables with certain solvents. This is generally regarded as not being a problem with ethanol, but there seems to be increased regulatory scrutiny as data emerges.
In 2004, a mixer, based on the Dean Vortex, was fabricated, and tested in an on-chip format – although it was not overly novel at this time, there were many versions before. Howell 4 described the action inside a Dean Vortex; when fluid is directed around a curve under pressure driven flow, the high velocity streams in the centre of the channel experience a greater centripetal force and so are deflected outward. This creates a pair of counter-rotating vortices moving fluid toward the inner wall at the top and bottom of the channel and toward the outer wall in the centre4.
Fig. 2 Cartoon design of the Microfluidic Bifurcating Mixer7
This work was built on by Chen et al 5 in 2011 by optimising the geometry of design using the effects of various Reynolds numbers and channel configurations. The paper noted “The results indicate that for low Reynolds numbers (<5) diffusion is the primary mechanism by which mixing occurs. At Reynolds numbers greater than 10, secondary flows come into play and the lamellar formation contributes to increased levels of mixing. There has been a litany of papers around the world with various versions of this style of mixer, all seeming to build on the previous works. The thesis by Ms Mathilde Enot, from Grenoble University – Pharmacy 6 focuses on the Dean Vortex Bifurcating Toroidal Mixer patented by Precision Nanosystems Inc. This comprehensive work defines the narrow ‘sweet spot’ this mixer has, not only with flow rates, but lipid concentrations to ensure the mixing conditions are maintained. To maintain formulation integrity across platforms, Enot describes the necessity to match the Reynolds numbers and Dean numbers of one system to another ensuring formulations are similar. Additionally, as she moved a formulation from the low volume system to the next volume device there was a significant increase in mechanical loss of the pDNA payload. Most commercial players attempt to sell the ‘journey’ from research up through to GMP, it is clear this may not be as seamless as they purport given the need to manufacture greater volumes means the mixing architecture must change to accommodate the change in flow, but still be able to maintain the Reynolds number, Dean number, and laminar flow conditions, despite the use of a Dean Vortex Bifurcating Toroidal Mixer design throughout the scaling steps.
Impinging Jets Mixers (IJM)
Opposed IJMs/reactors are generally divided into two types, depending on the geometry: Confined impinging jets mixers with cylindrical chamber and injectors and T-jets mixers with rectangular cross-section chamber and injectors10.
T- mixers
By absolute definition the T mixer isn’t a microfluidic process as the mixer dimensions are over 1mm. As the name suggests, two streams are forced toward each other with a perpendicular output. To be efficient in the mix, both streams need to be of equivalent force and at quite high flow rates. This can be a limitation given it would be difficult to scale it down for low volume applications. Low flow rates minimise the effectiveness of the turbulence required, and it is likely side-by-side diffusion.
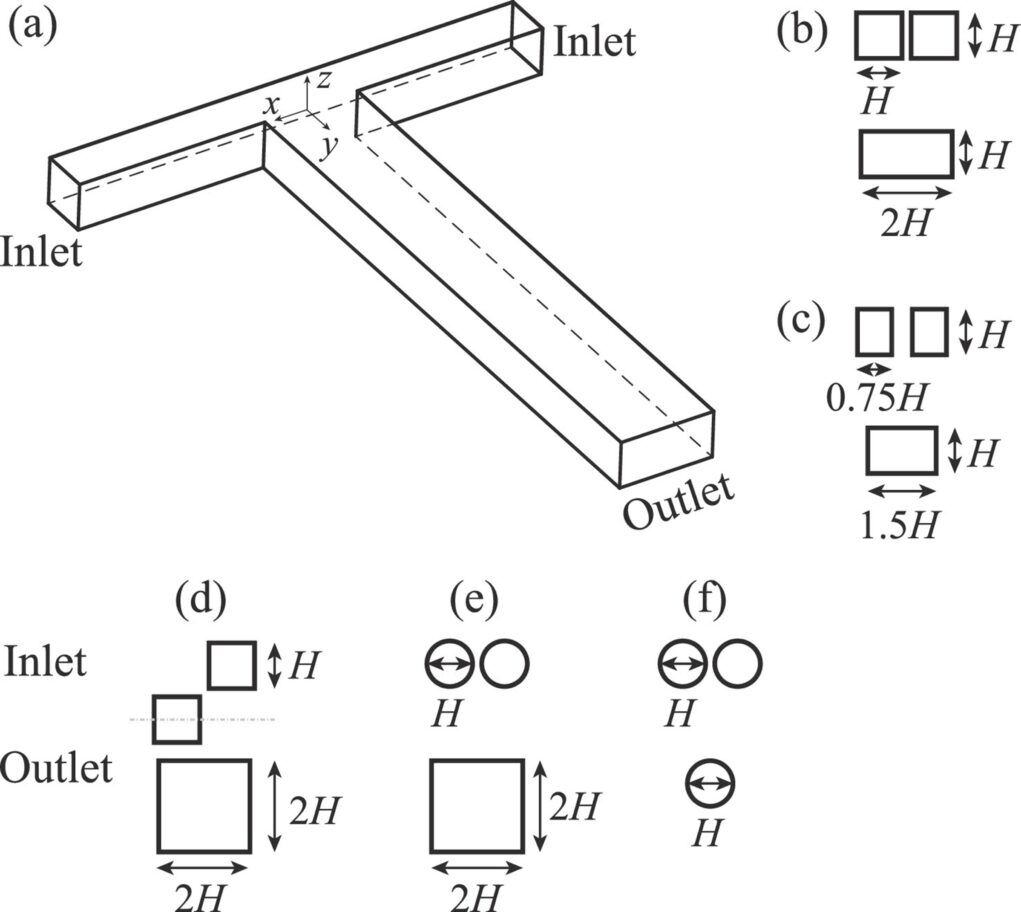
Fig. 3. (a) A schematic illustration of a T-junction section, where a Cartesian coordinate is set with the origin located at the Centrepoint of the junction. (b–f) Geometries of the inlets and the outlet8.
Huixin Li 8 explored the numerical and experimental simulations elucidating the elementary fundamentals of fluids mixing in a T-Mixer. This manuscript discusses at length the correlation of mathematical models such as Reynolds Number (Re), Schmidt Number, the Navier-Stokes (NS) equations used to describe the flows. Particle Image Velocimetry (PIV) is an optical method used to measure instantaneous velocity of flows. Li used this method amongst others to determine the validity of the mathematical simulations. Decades of flow research and Li concedes “Overall, more efforts are necessary and greatly favoured to advance the knowledge of (turbulent) mixing in T-mixers.”8 Clearly the unpredictable nature of turbulent flows would question the suitability of this method to be useful when developing a medical treatment for injection into a human patient given such variability.
Confined Impinging Jet Mixers
A Confined Impinging Jet Mixer (CIJM) has two impinging jets with equal momenta. The liquid solutions, typically a solvent and a non-solvent, are injected into the CIJM and deflect off each other, creating extreme turbulence and rapid mixing. Nanoprecipitation occurs in an order of milliseconds, thus mixing must occur within this short window of time. Due to the speed and chaotic nature of this mixing processes, it is difficult to make predictions without a posteriori knowledge.9
Fig. 4 Planar Laser Induced Fluorescence (PLIF) technique image of impingement mixing of a binary mixture. 10
Pereira da Fonte’s10 dissertation focused on high viscosity monomers and pre- polymer mixing for Reaction Injection Moulding. Whilst not particularly suited to this topic of Lipid nanoparticle formulation, there are fundamental learnings from this work. Importantly Pereira da Fonte noted:
” Unbalanced jet conditions were found to affect the flow significantly by moving the impingement point towards the chamber walls. Under unbalanced conditions, the jets’ oscillations are partially or completely damped, even when a dynamic flow regime is expected10”. It is critical that impingement mixing occurs at the centre of the mixing chamber. Additionally, “When the Reynolds number is increased, maintaining the jets’ kinetic energy rate ratio and at values different from one, the impingement point moves towards the chamber walls, closer to the lowest Reynolds number jet side. This phenomenon indicates that the impinging jets flow becomes more sensitive to small deviations in flow rates as Re is increased10”.
Direct Number Simulation (DNS) modelling for such mixers is restricted to low Reynolds Numbers given the terrific amount of computational time, this can be enumerated for a sense of magnitude. Pope 11 “estimated that if the Re is doubled from 1,500 to 6,000 for a simulation of isotropic turbulence that is run at 1 gigaflop*, the simulation time increases from 13 days to 20 months. This is because the amount of floating-point number computations increases with Re by a cubed factor 9”.
*If computational Mathematics is not your forte – a Gigaflop is 1 billion floating point operations per second.
Understanding the predictive nature of a CIJM is seemingly more complex than a ‘simple’ T-Mixer, whilst not out of the question there will be a method to predict the result from the inputs, given the decades devoted to T-mixers, I feel it is unwise to hold your breath whilst waiting for this to occur.
Fig. 5. Instantaneous contour plot of velocity magnitude for (a) Re=62 and (b) Re=310. The streamlines of the flow for two different Re values. Large and small eddies form inside the mixing chamber and circulate before escaping through the outlet. While both simulations appear to depict turbulent flow, the higher-Re flow is much more chaotic than the lower-Re flow. The higher velocity allows the fluids to reach the top of the mixing chamber and swirl around the boundary. Ultimately, the Launder-Reece–Rodi Turbulence Model (LRR) model yields accurate predictions of the velocity fields, but there appears to be a limit at Re = 310 where the solution produces an error similar in magnitude to those of the Direct Number Simulations (DNS) predictions at Re = 62. 9
Typically, these systems are notoriously difficult to control the output, furthermore, their use in a GMP context must be nightmarish and costly to change out all that tubing for a cleaning validation. Tying this method to an optimal condition would require a robust analysis method with dramatic feedback loops to effect a change should the output stray from the desired condition.
Gaining insight into the optimal condition is difficult but it is clear moving from a laminar state to a turbulent state computationally ‘all hell breaks loose’.
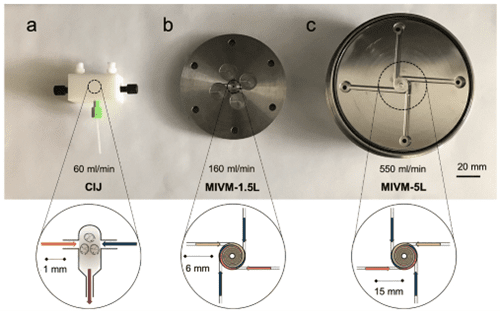
For completeness, the Flash NanoPrecipitation (FNP)12 method produced by Robert Prud’homme of Princeton University, was primarily a CIJM followed by a MIVM (Multi-Inlet Vortex Mixer) and then scaled down to a µMIVM, essentially a vortex mixing device with multiple inlets (4) to separate the input streams. Intriguing design with a deal of promise, however, the complexity of the system and lack of available data may hinder its adoption for full scale GMP production. It is worth keeping in mind that it could be a valid technique once the fluid dynamics are shown to be reproducible without great sample loss.
Fig. 6 Images a) CIJM b) MIVM- 1.5 L and c) MIVM 5L 13.
Paradigm shift
Numerous ‘me too’ systems are attempting to enhance the current popularism’s and in some instances directly copy existing technology, hoping to ride the wave of good fortune, but lacking novelty as evidenced by the depth of historical research.
Many systems employ a ’one size fits all’ approach. Ultimately, they are inflexible operating in the constrains of their technological sweet spot, selling on the small then scale up – actually scale out – as they increase in size the physics falls over relegating them to create duplicates, effectively parallelising.
In science, often it is difficult to be across interdisciplinary technologies, with your goggles on, in your own bubble, but failing to step out and look to alternative solutions. All too frequently we are caught up in the trending technology considering them to be the only options. Unique companies such as ATA Scientific are multidisciplinary spanning a huge array of industries with incredible investment in our people enabling vision to identify solutions, at times to the most perplexing of problems.
When Theory collides with practice
The Golden Rules for LNP creation have been touted as: 1) Mixing rate must be faster than assembly rate 2) Mixing must be in laminar flow…. MAYBE I have added MAYBE…. This is a function of watching a formulation repeatedly arrive at the precise predicted size and other formulation attributes when created in a T-Mixer. Perplexing if you advocate laminar flow given this is definitely not. What is occurring here is an extremely honed formulation tailored to the defined architecture of the mixer, evidenced by the inability to scale up or transfer to another technology. In comparison, AXF was able to be configured to emulate the formulation and do it at scale with minimal effort.
Advanced Cross Flow (AXF)
Loughborough University – Micropore Technologies was spun out of the internationally respected Loughborough University Chemical Engineering Department. The patented technology was invented by Professor Richard Holdich, former Head of the Chemical Engineering Department. For comprehensiveness, the original membrane technology was invented in Japan by Tadao Nakashima and Masataka Shimizu of SPG Research Laboratory, Miyazaki Prefectural Industrial Technology Centre in 1986.
The key point in this humble introduction is to note this technology was developed for emulsion creation in chemical engineering applications, worlds away from nanoprecipitation and lipid nanoparticles. This highly awarded technology was adapted into the Lipid NanoParticles (LNP) field when COVID -19 was ravaging the planet. It was during this time Micropore Technologies contacted Prof Yvonne Perrie, Head of Institute, Strathclyde Institute of Pharmacy and Biomedical Sciences – University of Strathclyde – Glasgow, in an effort to determine if the Membrane technology would be useful in encapsulating RNA into a LNP for large scale manufacture. During a 2021 webinar, Perrie noted that not only was it reproducible across a range of flow rates, the AXF system was showing very good Encapsulation Efficiency and volume14. There is ongoing collaboration with Strathclyde University.
Figure 7 is a basic schematic of the AXF-1 as noted in a paper by Holdich R., Dragosavac M., Williams B., Trotter S.15 which largely discussed the technology as a single pass annular cross flow membrane for the emulsions and dispersions industry elucidates some key fundamentals.
Fig. 7 Single-pass crossflow membrane emulsification15: (a) Schematic illustration of the annular flow system with insert and tubular membrane in place (note that outer shroud is not shown); (b) external image of the shroud and fittings for sealing the internal components; and (c) SEM of laser drilled stainless steel membrane.
Deceptively simple, the complex flow interactions afford a diverse applicability across a range of emulsions and dispersions plus, as we will explore LNPs. Holdich et al identified predictive equations defining drop size as a function of shear stress.
Equation (1)
‘For interpretation of the results, a previously published equation for drop diameter (x) as a function of membrane pore radius (rp), shear stress at the surface of the membrane (τ), and interfacial tension (γ) was used,3 Equation (1). The equation results from considering a force balance at the surface of a pore as a drop emerges, where the only forces considered relevant are the capillary pressure retaining the drop to the surface and the drag force induced by the wall shear stress. This equation has generally been found to predict the drop size at very low injection rates, the drop size increasing with injection rate, while maintaining the same surface shear stress.’15
Fig. 8 (a) Drop size of silica precursor as a function of shear stress for the hydrophobic membrane system and comparison with Equation (1). (b) Images of the silica precursor beads produced at various shear stresses.
Whilst the above is a drastically abridged version of the findings, there is merit in noting the predictability of this platform. Confidence that simple equations can be built on to describe phenomena noted in practice, in distinct contrast to turbulent flow models.
Assessing this system initially for pertinence with LNPs was encouragingly simple. A basic lipid mix of 1-palmitoyl-2-oleoyl-glycero-3-phosphocholine (POPC) 52%, Cholesterol (ovine) 45%, DSPE-PEG 3% was formulated against a aqueous phase of Phosphate Buffer Solution (PBS) using a syringe pump and a smaller version of the AXF-1 called the Mini (Fig. 9). The pore sizes had been changed to that used for emulsions given the method required little shear as it operates with nanoprecipitation. Uniform particles were formed in seconds. In a request for further control, the formulation was presented to the high throughput AXF™ Pathfinder (Fig. 10). This equipment enables formulations to be ramped through a range of flow rates to aid in defining the optimum state. It took seconds to assess the ideal condition to produce particles of 55 nm with a polydispersity Index (PDI) of 0.06.
Fig. 9 Micropore AXF-Mini
Testing this in real world conditions was the next challenge. A simple syringe pump and Micropore Mini rig was run independently at the University of NSW RNA Institute, Sydney, Australia where a SM-102 formulation was created encapsulating RNA produced on site. Dr Febrina Sandra noted the following with a flow rate of 12 ml / min: Particle size (z-average) 110 ±1.54 nm, PDI 0.178 ±0.012, Encapsulation Efficiency (EE) 96.14 %. This was tremendous given it was a very simple, uncontrolled rig. The University of Strathclyde are typically enjoying EE beyond 98%, in some formulations they are approaching 100%. It is worth noting, there is a significant cost attributed to every 1% drop in EE in the context of GMP production.
Fig. 10 Micropore Pathfinder
From a research point of view, there is a lot to like about the Pathfinder. The key is the enormous flexibility it offers. Breaking the ‘one size fits all’ limitation decreed by alternate methods, the Micropore AXF system constructed with 316 stainless-steel, with seemingly limitless variants of membrane design enables fundamental research to move forward beyond the current paradigm of formulation constraints and consumable costs into unchartered, innovative discoveries utilising formulation constituents currently avoided due to equipment incapability. Accepting a novel method requires rigor in testing and comparison to known entities, this has been easily established for the Pathfinder. As with most R&D techniques, the real issue is how to scale up, after all, if this research is to be translated to treatments, it needs to build to sufficient volumes.
How does the Micropore AXF system handle scale?
The flexibility of the Micropore AXF system becomes clear when moving to scale. The identical mixer can move from a single device to deliver a 200 ul sample to 5 -10 litres on the Pathfinder series. Specifically, what you formulate is absolutely scalable without tweaks and changes, which for those that need to meet the requirements of the regulators, this is spectacular. If a closed system is required for GMP production, the very same mixer on the Pathfinder (AXF-Mini) can be used in the Horizon™ m (Fig. 11).
Fig. 11 Horizon m
This is an open skid design with custom control architecture, SS 316L throughout – no consumables. Integrated LNP manufacture and dilution in a system that is fully CFR 21 Part 11 compliant capable of production volumes of 0.5 – 2000 Liters / hr. Custom built to client specification for capacity, feed system (pumped or pressure), full DQ / IQ / OQ / PQ support and PLC Integration.
Whilst this is impressive, consider it is the smallest version of the AXF. The range is astonishing. The AXF-1 as shown in Fig. 7 above, has a total flow rate of 2000 ml / min. Parallelise the AXF-1 to an AXF-4 and we begin to approach pandemic readiness (Fig. 12).
Empirically, it is likely to produce the following under the stated conditions.
Total flow rate (mL/min): 8000 RNA concentration (μg/mL): 59 RNA dose (μg): 30 Annual production (doses): 3.5 billion.
Fig. 12 Horizon IV
This is not a pipe dream, the first GMP Pathfinder has been installed and commissioned, the first Horizon system has been ordered and is likely to be commissioned Q1 2024, this is for a 1 billion dose facility. Clean in place (CIP)/ steam in place (SIP) makes economic sense, considering single use fluid paths can be very expensive, often well beyond the CIP / SIP option.
Micropore Technologies is working on resolving a major bottleneck in the production of nanomedicines. The Tangential Flow Filtration step that can take many hours to complete and is horrendously detrimental to the particles reducing EEs considerably – costing millions of dollars in payload and time. Not yet developed fully, but seductively intriguing, imagine using the AXF system as a single pass TFF.
Wrap up
One customer lauded the Micropore system given it floated their research boat (or in other words, met their research needs) as it is the antithesis of the black box they currently use. They see fundamental research opportunities to work with novel carriers not only due to the construction material, but the scope to make changes. Not all lipids react in the same way, and we seem to be stuck in this lipid world which is awash with IP constraints as a few want to cash in, to the detriment of 1000’s of researchers and perhaps the discovery of a lifesaving treatment. There is a need to hyperdrive the use of novel delivery modalities and the Pathfinder is nicely poised to accommodate.
What is abundantly clear is the current offerings have very strict boundaries of optimal operation evidenced by their inability to effectively scale up. Clearly, if they try to, the physics falls over. As a prominent researcher suggested to me about the prospect of Pathfinder – He said… “Pete, you’re going to democratise medicine – Again”.
Micropore will change this world. We just need to help them along this magic journey!
References
1. Tae Joon Kwak, “Convex Grooves in Staggered Herringbone Mixer Improve Mixing Efficiency of Laminar Flow in Microchannel,” Plos One, 4 Nov 2016.
2. Aubin J., “CHARACTERIZATION OF THE MIXING QUALITY IN MICROMIXERS,” Chem. Eng. Techno, pp. 26(12), 1262-1270, , 2003.
3. Maeki M., “A strategy for synthesis of lipid nanoparticles using microfluidic devices with a mixer structure,” RSC Advances, pp. 5, 46181, 17 March 2015.
4. Howell P. et al “Design and evaluation of a Dean vortex-based micromixer” Lab on a Chip, issue 6, 2004. https://pubs.rsc.org/en/content/articlelanding/2004/lc/b407170k
5. Chen j j, “Optimal Designs of Staggered Dean Vortex Micromixers” Int. J. Mol. Sci. 2011, 12, 3500-3524; doi:10.3390/ijms12063500. ttps://www.researchgate.net/publication/51484299
6. Mme Mathilde ENOT, “How do process parameters impact the microfluidic formulation of Lipid nanoparticles encapsulating nucleic acid” Pharmaceutical Sciences 2022 dumas-03878803, https://dumas.ccsd.cnrs.fr/dumas-03878803
8. Li H. “An overview of fluids mixing in T-shaped mixers” Theoretical and Applied Mechanics Letters, Volume 13, Issue 4, 2023. https://doi.org/10.1016/j.taml.2023.100466
9. Madadi-Kandjani E. “Investigation of the mixing inside the confined impinging jet mixer using the Fokker–Planck mixing model” Chemical Engineering Science 273 (2023) 118634 https://doi.org/10.1016/j.ces.2023.118634
10. Pereira da Fonte C A. “Mixing Studies with Impinging Jets” Ph.D. Dissertation in Chemical and Biological Engineering, LA LSRE/LCM-FEUP, Universidade do Porto, November 2012.
11. Pope S.B. “Turbulent Flows” Cambridge University Press 2000.
12. Markwalter C.E., Prud’homme R. “Design of a Small-Scale Multi-Inlet Vortex Mixer for Scalable Nanoparticle Production and Application to the Encapsulation of Biologics by Inverse Flash NanoPrecipitation” J Pharm Sci. 2018 Sep; 107(9): 2465–2471.
13. Feng, J., Markwalter, C.E., Tian, C. et al. Translational formulation of nanoparticle therapeutics from laboratory discovery to clinical scale. J Transl Med 17, 200 (2019). https://doi.org/10.1186/s12967-019-1945-9
15. Holdich R., Dragosavac M., Williams B., Trotter S. “High throughput membrane emulsification using a single-pass annular flow crossflow membrane” AIChE Journal, Volume: 66, Issue: 6, First published: 26 February 2020, DOI: (10.1002/aic.16958)
Formulate your nanoparticles fast with high precision and easy scale-up. Apply for a free trial of this advanced crossflow mixing technology to accelerate liposome processing and nanoparticle formulation with highly controlled particle size.
If your work requires you to formulate nanoparticles, particularly for drug delivery, you are encouraged to apply for a free trial of a Micropore AXF Pathfinder. You will need to provide a description of your research project including your current methods and formulation objectives. If we assess that the Pathfinder can provide significant advances for your project, then you could receive the following:
* Free use of a Micropore AXF Pathfinder unit
* Free use of supporting nano particle sizing analysers including fluorescence detection
* Training and support to optimise your formulation procedure
The Micropore Pathfinder is a compact Integrated benchtop unit for faster, cheaper, more efficient and scalable production of nanoparticles via advanced cross-flow mixing. Using a 316 stainless-steel precision engineered membrane, Pathfinder reduces the cost and accelerates the development of genomic medicines from lab bench to manufacturing scale. All this from a mixing device small enough to fit in the palm of your hand, easily disassembles, is simple to clean and requires no single-use consumables! This proven technology has multiple applications including pharmaceuticals/ medicines/ veterinary vaccines/ food/ cosmetics and chemicals.
How to apply
This free trial is open to researchers who work in organisations located in Australian or New Zealand. Priority will be given for projects that require scale up for future trial and manufacturing quantities. PhD and Masters students applications must include a letter of recommendation from their supervisor or manager. Please limit your application to 1 A4 page. Applications will be accepted from 1st Nov 2023.
The free trials will be offered for a period of 3 months starting from 1st February 2024 until 30th April 2024.


 02 9541 3500