


 02 9541 3500
Livecyte changes what’s possible to measure using live cell assays
28 Jan, 2022 | Newsletters
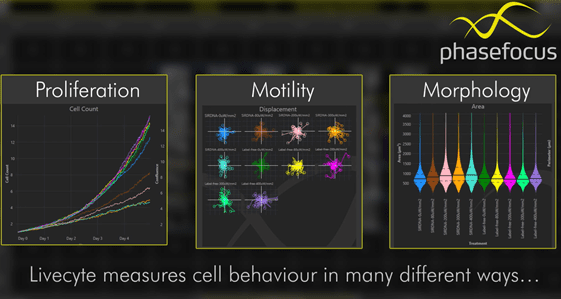
| Multiple Outputs in a Single View Livecyte produces high contrast time-lapse videos for a range of label-free assays. Automated single-cell tracking of even the most sensitive cells quickly reveals subtle phenotypic differences in unperturbed cell populations. Livecyte’s easy-to-use Dashboards view generates groups of graphs which provide detailed descriptions of different phenotypic behaviours and any outlying characteristics. Take a look at the links below for a summary of applications where the Dashboards may be useful. CONTACT US FOR A DEMO 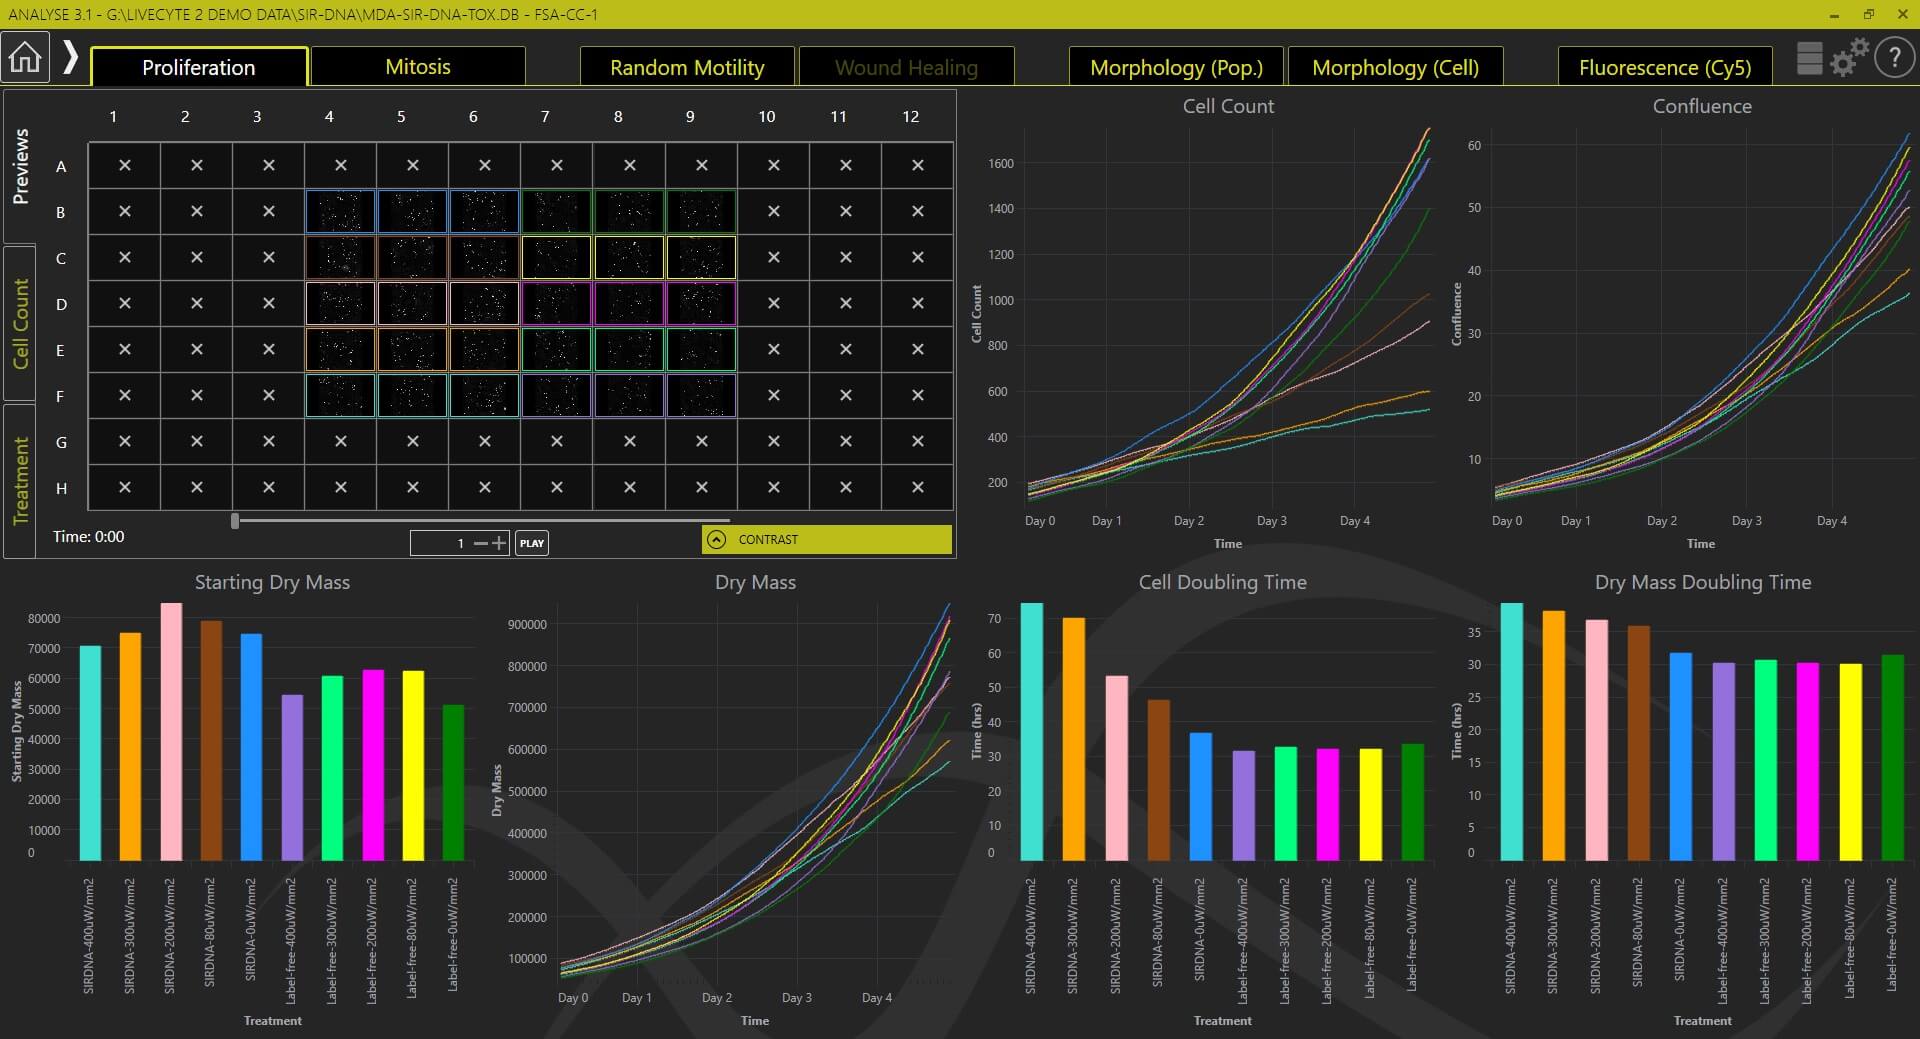 Proliferation Dashboard Outputs Cell Count, Confluence, Starting Dry Mass, Dry Mass, Cell Doubling Time, Dry Mass Doubling Time READ MORE  Motility Dashboard Outputs Instantaneous Velocity, Directionality, Track Speed, Displacement, Mean Velocity, Confinement Ratio READ MORE  Wound Healing Dashboard Outputs Starting Area, Area, Area T1/2, Collective Migration, Leading Edge Track Speed, Directionality READ MORE  Morphology Dashboard Outputs Confluence, Dry Mass, Area, Perimeter, Length Width Ratio, Sphericity READ MORE  Fluorescence Dashboard Outputs Median Integrated Intensity, Integrated Intensity, Total Integrated Intensity READ MORE Using the Livecyte at St George’s University of London In this video researchers from St George’s University of London, discuss their use of the Livecyte system. Greg Perry , Image Resource Facility Microscopy Manager said “I think the sheer depth of analytical possibility is really starting to dawn on people. You can generate incredibly complex outputs but you’ve got the surface level analysis too. It ticks all boxes! The duality of the simple, super easy to grasp operation of the system, but the sheer depth of what you can do with it, is very inspiring.” LISTEN TO WHAT USERS FROM ST GEORGE UNI HAVE TO SAY  |
| I would like a Livecyte demo I would like a Livecyte quote Email me with more info |
 |